Activity
Mon
Wed
Fri
Sun
Feb
Mar
Apr
May
Jun
Jul
Aug
Sep
Oct
Nov
Dec
What is this?
Less
More
Memberships
Invest & Retire Community
3.3k members • Free
21 contributions to Invest & Retire Community

Mar '24 •
$1,000 per Month via LULU
I collected $1,010 premium this morning 3/11/24 by selling put on LULU with 3/22/24 expiration. Why: 1). @Eric Seto had posted that indicating he Forecast earning will be positive (earning call is around the corner 3/26/24) 2). $425 is below 11/27/23, support level of $427.73. Market is at $459ish. WOW already achieved the goal. Thanks Eric!

3 likes • Jul '25
Here's a breakdown of Monica Bernard's option strategy on LULU, how it's performed, and whether it's a good strategy the way she applied it: 📌 Monica’s Strategy Summary: Monica is using the Wheel Strategy on LULU: 1. Sell cash-secured puts to collect premium. 2. If assigned (forced to buy the stock), then: 3. Sell covered calls on the assigned shares to collect more premium until the stock is called away. This is known as the "Wheel" because the cycle repeats if the stock is called away or new puts are sold. 🧾 Timeline of Her Trades: 📅 March 2024 - Sold Put at $425 — received $1,010 premium. - Assigned at $425 (stock dropped). - Now owns 100 LULU shares at $425 cost basis. 📅 April – December 2024 - Repeatedly sold covered calls at or just under $435 (trying to avoid early assignment). - Stock never recovered to $425+, so shares were never called away. - Earned more premium, but still underwater on paper. 📅 Throughout 2024 – 2025 - Sold additional cash-secured puts at progressively lower strikes ($300 → $280 → $240). - Her rationale: if assigned again, she would average down her cost basis. - She’s also been rolling puts (extending expiration) to avoid assignment. 💰 Total Premium Collected: - As of July 25, 2025: $5,260 in cumulative premium. 📉 Current Situation: - Still holding 100 shares of LULU at $425, now trading around $240. - That’s a paper loss of ~$18,500 ($185/share × 100 shares). - Net loss reduced by $5,260 in premium, so realized + unrealized loss = approx. $13,240 (if stock never recovers). 🎯 Is the Strategy Good the Way She Applies It? ✅ Strengths: - She stuck to a defined strategy (wheel). - Collected consistent premium, reducing cost basis. - Didn’t panic sell during drawdown. - Has a long-term tax strategy (waiting for 1-year mark to reduce capital gains tax). ❌ Weaknesses: - Wrong stock selection: She initiated the wheel on a volatile, overpriced discretionary stock. Unlike MSFT or AAPL, LULU is much more prone to earnings surprises and sentiment shifts. - Poor entry timing: Started right before earnings at a high level ($459), betting on earnings that failed to support the price. - Didn’t cut losses or reposition early: Holding for too long without adjusting the core thesis or switching to a stronger stock. - Averaging down blindly**: This is risky if the underlying stock is in a long-term downtrend. LULU has dropped ~48% from her initial assignment.

Jul '25 •
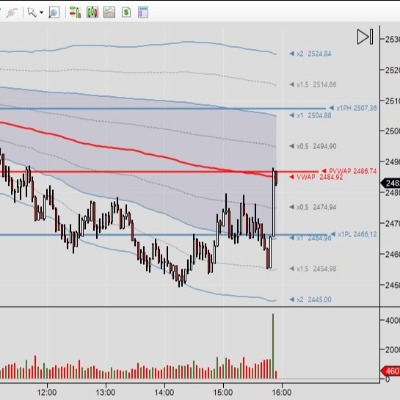
Chart set up
Chart set up video describe to set up three indicators - Bollinger Band and two EMAs; however Trading view allows only two indicators for free. How to add the third?
3 likes • Jul '25
//@version=5 indicator("Bollinger Bands + Dual MAs", overlay=true) // === MA Settings === maType = input.string("SMA", title="MA Type", options=["SMA", "EMA"]) fastLen = input.int(50, minval=1, title="Fast MA Length (e.g. 50)") slowLen = input.int(200, minval=1, title="Slow MA Length (e.g. 200)") colorFastMA = input.color(color.orange, title="Fast MA Color") colorSlowMA = input.color(color.blue, title="Slow MA Color") // === Bollinger Band Settings === bbLen = input.int(20, minval=1, title="Bollinger Band Length") bbMult = input.float(2.0, title="Bollinger Band StdDev Multiplier") bbColorMid = input.color(color.gray, title="BB Mid Line Color") bbColorUpper = input.color(color.teal, title="BB Upper Band Color") bbColorLower = input.color(color.teal, title="BB Lower Band Color") bbFillColor = input.color(color.teal, title="BB Fill Color", inline="fill") bbFillTransp = input.int(90, title="BB Fill Transparency", minval=0, maxval=100, inline="fill") // === MA Function === getMA(src, len) => maType == "EMA" ? ta.ema(src, len) : ta.sma(src, len) // === Compute MAs === maFast = getMA(close, fastLen) maSlow = getMA(close, slowLen) // === Compute Bollinger Bands === basis = ta.sma(close, bbLen) dev = bbMult * ta.stdev(close, bbLen) upper = basis + dev lower = basis - dev // === Plot MAs === plot(maFast, color=colorFastMA, title="Fast MA") plot(maSlow, color=colorSlowMA, title="Slow MA") // === Plot Bollinger Bands === plot(basis, color=bbColorMid, title="BB Basis") plot(upper, color=bbColorUpper, title="BB Upper") plot(lower, color=bbColorLower, title="BB Lower") fill(plot1=upper, plot2=lower, color=bbFillColor, transp=bbFillTransp)
2 likes • Jul '25
Step-by-Step: How to Use in TradingView ✅ Step 1: Open Pine Script Editor 1. Go to https://www.tradingview.com/ and log in. 2. Open any chart (e.g. BTCUSD, SPY, AAPL, etc.). 3. At the bottom of the screen, click the “Pine Editor” tab. ✅ Step 2: Paste the Script 1. Delete any code you see in the Pine Editor. 2. Copy the full script I gave you above. 3. Paste it into the editor. ✅ Step 3: Add to Chart 1. Click the “Add to Chart” button (above the editor). 2. You should now see: 3. You’re only using 1 indicator slot 🎉 ✅ Step 4: Save and Name the Script 1. Click the disk icon (💾) in the Pine Editor toolbar. 2. Give your script a name like "BB + Dual MAs" and click Save. ✅ Step 5: Customize Settings 1. On your chart, hover over the indicator name (BB + Dual MAs) in the top-left corner. 2. Click the ⚙️ settings icon. 3. You can now: ✅ Step 6: Add One More Indicator (Optional) You still have 1 free indicator slot, so you can: - Add RSI, MACD, Volume, or any built-in indicator you like. - Enjoy a more complete setup without upgrading to a paid plan. 🧠 Tips for Use - The 50/200 MA combo is popular for spotting golden/death crosses. - Bollinger Bands help identify volatility squeezes and overbought/oversold conditions. - You can combine both tools to confirm trend and entry zones.

Mar '25 •
Once trust is lost, it is difficult to repair (4D Chess Move) - LMT
Take a look at LMT stock - down from $620 to $440 (-30% in 5 months) Recently, the conflict between US and Canada has piqued my interest in defense technology such as German Rheinmetall. You can take a look at the chart and see that it has skyrocketed. Let me cue you in for the latest development: "Trump open to selling allies 'toned-down' version of next-gen F-47 fighter" (Source) "Canada reconsidering F-35 purchase amid tensions with Washington, says minister" (Source) "Europe and Canada are eyeing alternatives to American-made fighter jets. Here's why" (Source) "Lockheed lost out to Boeing to produce the next-generation fighter jet for the U.S., the Trump administration announced." (Source) "Lockheed Martin offers to create more jobs in Canada if Ottawa commits to full order for F-35 fighter jets" (Source) "Canada buys Australian radar system as Europe and America’s northern neighbor eye weaning themselves off U.S. military gear" (Source) As you can see, trust between governments has a significant impact which echoes around the globe. The decline for LMT isn't temporary. It's a fundamental shift away from its business (US based) and you can see how desperate LMT is given that it offers to create more jobs in Canada. Canada wouldn't be able to accept LMT offers even if there are more jobs as the unreliability of the government imposes national security risk to Canada.
2 likes • Mar '25
@Abbie Eiley As for what voters were thinking last fall, it probably came down to: 1. Economic frustrations – Inflation, cost of living, and jobs were major concerns. 2. Partisan loyalty – Many voters stick to their party, no matter what. 3. Misinformation & media influence – Different news sources push different narratives. 4. Lack of good alternatives – Sometimes, voters feel like they’re picking the “least bad” option.
4 likes • Mar '25
@Cris Bob The stock might keep dropping if: 1. More contracts go to competitors – Boeing, Northrop Grumman, or even European defense companies (like Rheinmetall) could take market share. 2. Geopolitical uncertainty continues – If allies keep distancing themselves from U.S. defense deals, LMT loses key customers. 3. Interest rates stay high – Defense stocks rely on government spending, and high rates pressure budgets. If LMT drops to $300-$350, it could become an interesting long-term play—unless the entire U.S. defense sector contracts permanently.
Feb '24 •
Questions Regarding "Making $1,000 a Month"
If I buy 100 shares of MSFT at the current price of $400 and sell a call option with a strike price of $405, and at expiration the current price is $395, I understand that I received the premium and still hold the shares with an unrealized loss of $5 per share. In the videos, it is mentioned that we can repeat this process each month. However, what if the price continues to decline and I repeat the same operation? For instance, if the current price drops to $385 the following month, and I sell a call option with a strike price of $390, and at expiration the current price is $392, I might end up with a realized loss of $8 per share. While this might not be catastrophic as the premium could potentially cover the difference, what if we enter a moderate correction ranging from 5% to 10% from recent highs? Would this strategy still be feasible, and how should we address such a scenario?
5 likes • Feb '24
@Leon K That's interesting. On average, how much time elapsed between each adjustment to tailor it to your liking? I'm asking because I'm interested in learning more about options trading, but I prefer strategies that don't require constant supervision that's why the monthly income the way it was presented was seducing.
5 likes • Feb '24
@Leon K is it possible to show a marker on you graph for each adjustment and the original entry. Alternatively, you can simply list the price levels at which adjustments were made.

Feb '24 •
US Stocks Weekly Performance - week ending 23 Feb 2024
Stocks that rose included: NVDA +8.4% AMZN +3% BRK-B +3% ABT +5.1% WMT +3.7% HD +3% Stocks that fell included: ADBE -6.2% TSLA -4.2% DIS -4% PANW -23% UBER -3.9%

4 likes • Feb '24
@Monica Bernard https://finviz.com/map.ashx?t=sec_all
1-10 of 21
@ian-bliss-3046
I am retired but my main occupation was programmer-analyst.
Active 124d ago
Joined Dec 28, 2022
Canada
Powered by