Activity
Mon
Wed
Fri
Sun
Jun
Jul
Aug
Sep
Oct
Nov
Dec
Jan
Feb
Mar
Apr
What is this?
Less
More
Owned by Saâd
Investing insights, halal crypto & equities, and a community of conscious Muslim investors. Built in Switzerland, for Muslims worldwide.
Memberships
Manychat Masterclass (Free)
2.1k members • Free
Skoolers
193.1k members • Free
185 contributions to Swiss Islamic Finance

9d •
The five-year drought is ending
The first bits of the time reversal that is happening on the crypto markets: https://swiss-islamic-finance.beehiiv.com/p/the-five-year-drought-is-ending Deeper analysis will be posted in the classroom.
0
0
9d •
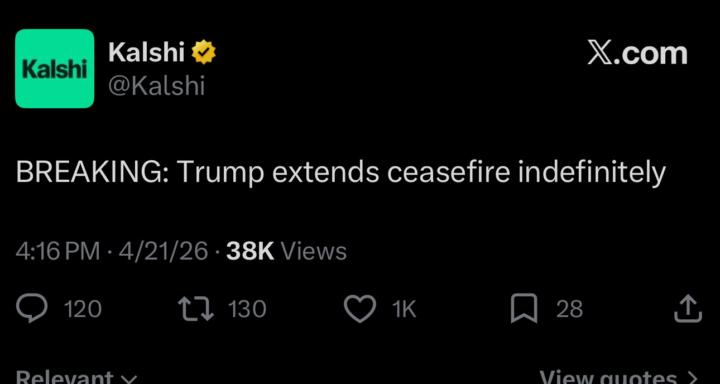
Reversal
Well can’t say we’re surprised. This is setting up for a huge date in late May. Lots of headlines coming between new fed chair in May. And likely a resolution on this back and forth with Iran
0
0
10d •
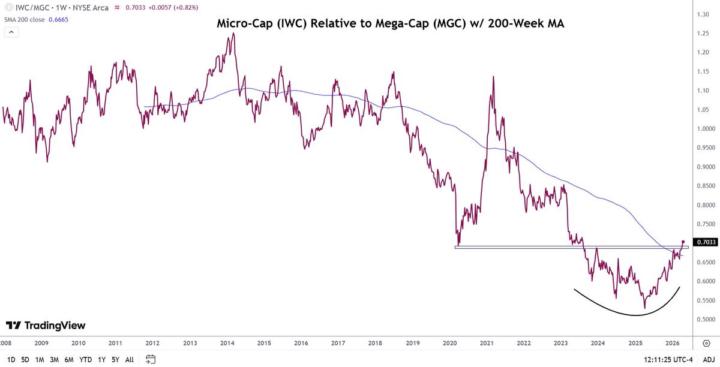
Bull run for small caps
Micro caps breaking out of a huge macro bottom against mega caps while making new ATH today. more and more evidence that the next 18-24 months will be one of, if not the greatest market run in history. More about this in this weeks newsletter
0
0
11d •
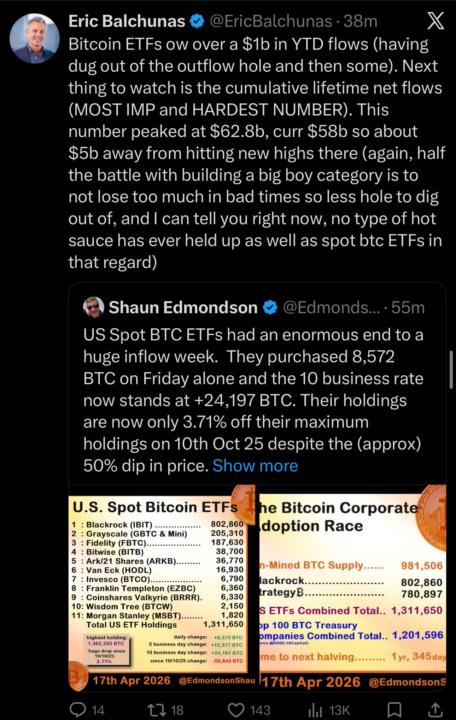
BTC ETF
The etf changed the game. There will be no 4 year cycle -75% correction. Cumulative net flows is just 5b off ATH levels even after -50%
0
0
19d •
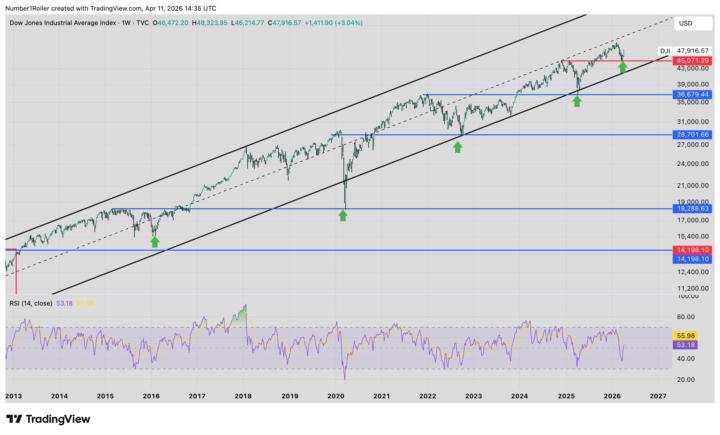
Dow Jones
here is a great chart of the DJI. very consistently retesting previous tops all the way up. remember this on BTC as tops become bottoms the bottom is very likely in on btc.
0
0
1-10 of 185
@saad-dhif-5173
We help Muslims grow wealth ethically in crypto, equities, and beyond.
Active 6h ago
Joined Nov 15, 2025
Zurich