Activity
Mon
Wed
Fri
Sun
Apr
May
Jun
Jul
Aug
Sep
Oct
Nov
Dec
Jan
Feb
Mar
What is this?
Less
More
Owned by Collin
Premier hub for intelligent betting - offering winning picks, a transparent record, proven strategies, expert support, and a place to celebrate wins.
Memberships
Swing Trading Desk
10 members • $49/month
The Digital Marketing Bar
67.5k members • $17
Skool Speedrun
12k members • Free
BettrNation
803 members • Free
Bettor Bonfire
361 members • Free
Skoolers
189.8k members • Free
7 contributions to Swing Trading Desk

5d •
My Highest Conviction Position Trades Right Now
A member asked me if the ADBE setup is valid again. Honestly — no. I don't like the market structure on it right now. But it made me realize I should share the names I actually DO like. These are my favorite setups and highest conviction position trades as of today. Two I'm already in, one I'm building a plan for. --- MSFT (Microsoft) — Long — Active Position Been on the watchlist multiple times. Nothing has changed. Demand is holding. HTF demand at 355-395. Institutional buyers stepped in here and price has tested this zone repeatedly without weakness. Key levels at 350 and 387. Technically strong. Fundamentally strong. Volume profile strong. One of my favorite setups out here. Mag 7. ⚡ EXECUTION PACKAGE Entry Zone: 355-395 (HTF demand — positioned from this zone) Stop: Below 355 (acceptance below invalidates) T1: 455 T2: Above 455 (structural targets developing) Risk: 0.5% of account Conviction: 8/10 — No weakness at demand despite multiple tests. Technically, fundamentally, and volume profile all aligned. Patience play — needs catalyst. 📋 GAME PLAN IF price shows strength from here → targeting 455+ IF price holds without strength → patience, stay in, stop honored IF acceptance below 355 → thesis invalidated, full exit Charts: Weekly | Daily --- GRAB — Long — Active Position (DCA) Super key level at $4. Just look at what this chart has done at this price historically. Multi-year accumulation between October 2024 and September 2025. Price broke out. Now retesting the origin of that breakout demand at 3.36-4.20. Started DCA'ing into this one. Fundamentals are very strong. Price is at the value area low on the volume profile — 70% of volume sits above. Institutions agree fair value is at least around $5. The price action is telling. October 2025 had aggressive, inefficient selling. Now? Barely any selling pressure. Every downswing is getting smaller. Compression. That's accumulation.

1 like • 5d
Good analysis. Just added some GRAB to the folio
Jan 28 •
[Closed] – ADBE – LONG – SWING
Status: Entry Filled / Managing TRADE SETUP Entry: - Long position entered at 302.76 - Entry taken inside higher-timeframe demand: 278–297 Key Level: - 279 - 255 Stop Loss: - 255 (hard stop) - A break below this level invalidates the trade Targets: - T1: 343 - T2: 400 - T3: 431 - T4: 500 - T5: 500+ MANAGEMENT PLAN - If price holds above 278.23, the position stays open. - If price breaks below 278.23, the position is closed — no re-entry. - At 343, partial profits will be taken and risk reduced. - If price continues higher, the remaining position is managed toward higher targets. - If price moves sideways, patience is required — no forced action. WHY THIS TRADE MAKES SENSE Price has pulled back into a higher-timeframe demand zone between 278 and 297. This zone was responsible for the prior move that carried price higher before distribution began near 635. When price leaves an area with strong expansion and does not return for an extended period, that area becomes a reference point for future reactions. The purpose of this trade is to observe whether that same area continues to attract buyers when price revisits it. At the moment, price is beginning to stabilize on the daily timeframe, suggesting that selling pressure may be slowing. This is not confirmation of a reversal, but it is consistent with what is typically seen when price responds to higher-timeframe demand. Risk is clearly defined. The position is invalidated if price trades below 278.23, which removes the demand thesis. As long as price remains above this level, the trade remains structurally intact. This is a location-based position, taken with the expectation that price may require time to develop. The focus is not on short-term movement, but on whether price can hold above demand and gradually work higher over time. 🔔 Tap the bell to stay updated as this trade develops.
![[Closed] – ADBE – LONG – SWING](https://assets.skool.com/f/9eedb258b74146de93effd8f637d192b/4b2f724118e948ea83403aabb908ff4b6dc68497daf0442a83d2392a9ddd7b33-md.png)
0 likes • 6d
Thoughts on re-entering now?
0 likes • 5d
@Albert Wang thanks
18d •
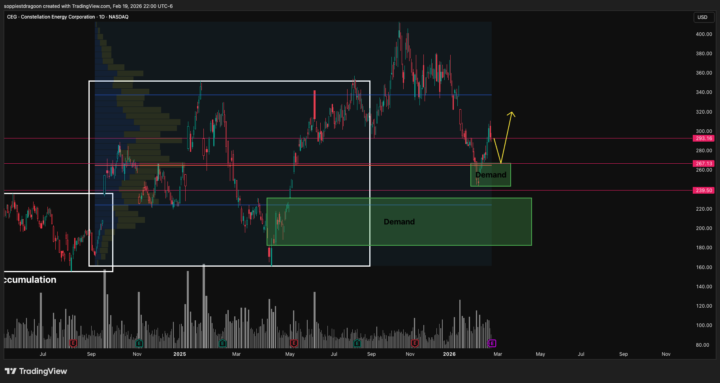
CEG — Bullish — Swing
⚡ EXECUTION PACKAGE - Entry Zone: $243–$267 (HTF demand / POC area) - Stop Loss: Below $243 (daily close acceptance below demand) - Target 1: $290–$300 range — take 50%, move stop to breakeven - Target 2: Prior highs — manage remainder - Risk Sizing: $50–$100 per setup - Invalidation: Acceptance below $243 on a daily close 📋 GAME PLAN IF price retraces into $243–$267 → THEN I'm looking for entry confirmation IF price shows rejection inside zone → THEN entry triggers, stop below $243 IF stop hit below $243 → THEN exit completely, no re-entry without new plan IF T1 reached → THEN take 50% profit, move stop to breakeven IF price never retraces → THEN NO ENTRY — this is not a chase setup IF price breaks below $243 with acceptance → THEN thesis invalid, secondary demand at $182–$231 becomes next area of interest 💡 SETUP CONTEXT Structure: CEG looks like it's put in a temporary bottom. Price is now within a HTF accumulation area with POC around $265. Demand zone: $243–$267. Edge: HTF structure + POC confluence = high-probability reaction area if price retraces Secondary Demand: $182–$231 — valid if primary demand fails, but a separate setup Why This Works: Clean invalidation below $243, strong R/R on a retrace entry Conviction: Conditional — only valid on retrace. Chasing current price = poor R/R. @Collin Farmer
1 like • 18d
Thanks!
19d •
Posting schedule
Will be back from travels tomorrow so we will resume normal posting schedule on Friday
1 like • 19d
Could you take a look at CEG?
Feb 5 •
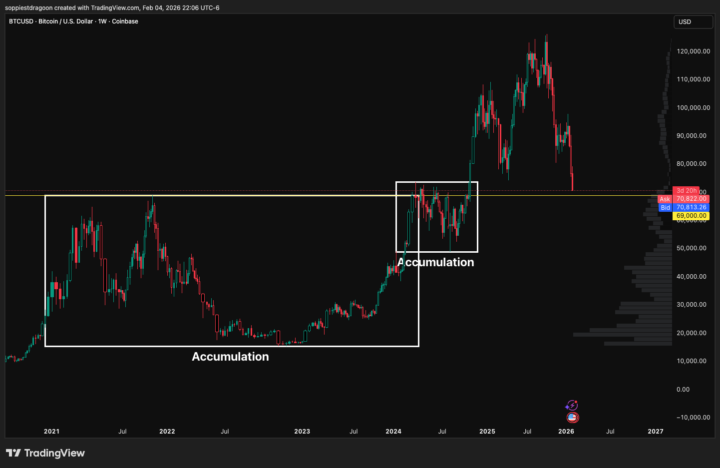
🟠 BITCOIN (BTC) — HTF ACCUMULATION & RISK MAP
1) BIG PICTURE (WHY THIS EVEN MATTERS) BTC is currently ~43% off all-time highs. This is not a bottom call.This is the zone where long-term asymmetry starts to show up because the risk/reward profile changes. Most commentary right now is recycled cycle slogans: - “3 up / 1 down” - “Must drop 80%” Those are backward-looking stats, not forward probability. Structure > slogans.We care about where downside becomes less efficient and where patient capital starts getting paid. 2) PROBABILITY STACK (WHY THIS ZONE MATTERS) 1️⃣ Production Cost “Floor” (Structural Anchor) Historically, Bitcoin does not live far below aggregate mining cost (electricity + tooling) for long. Current estimates cluster in the high-60Ks to low-70Ks. Below that level, every additional dollar of downside becomes less efficient: - Miners capitulate faster - Forced sellers exhaust sooner - Larger players quietly scale in This is structural, not emotional. 2️⃣ 200-Week Moving Average (Institutional Reference) The 200W MA currently sits just under the high-50Ks. It’s not magic — it’s a shared reference for slow money.As price moves, the MA likely grinds up toward ~60K, creating confluence with the accumulation zone. Confluence ≠ certainty.It simply tilts odds. 3️⃣ Drawdown Context (Reality Check) Yes — older cycles saw ~80% drawdowns, implying $30–40K. For that to play out, you’d likely need: - Aggressive macro tightening - A true liquidity rug-pull - Structural demand failure (not just volatility) That path exists — but current odds are lower than social-media fear implies. Reminder: Risk is impact, not just likelihood. 3) HIGH-PROBABILITY ACCUMULATION ZONE Primary DCA Window:👉 $65,000 → $50,000 Inside this band: - Downside becomes more incremental, not existential, for long-term capital - Upside multiples start justifying measured heat - You’re buying structure, not headlines This is not an all-in zone.This is a scale-in, let-time-work zone.
0 likes • Feb 5
@Albert Wang right, we'd be catching a falling knife right now. I'd look at something avaliable on RH like PEPE or BONK. On RH to avoid crazy spreads and fees, and also those two coins in particular have pumped like crazy in recent history, so it's reasonable to assume they will again
0 likes • Feb 5
@Albert Wang dope. Thanks
1-7 of 7