Activity
Mon
Wed
Fri
Sun
Feb
Mar
Apr
May
Jun
Jul
Aug
Sep
Oct
Nov
Dec
Jan
What is this?
Less
More
Memberships
Make $1k-$10k in 30 days
13.6k members • Free
14 contributions to Make $1k-$10k in 30 days

16h •
First Day
This is my first day here I am facing issue to understand how to start and from where to start!

0 likes • 4h
Welcome to the community, bro first of all see pinned videos, after that you will be able to start something and when you start you get guide from here for sure.
4h •
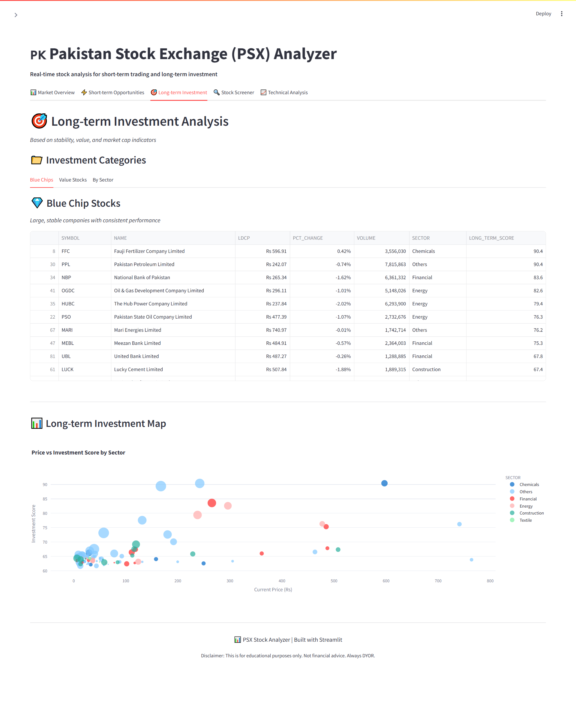
Data Science Project: Real Time Pak Stock Exchange (PSX) Performance Tracker
I built a real-time Pakistan Stock Exchange (PSX) data analysis system and interactive dashboard to demonstrate how data science can be applied to local financial markets, not just US stocks. 🎯 Purpose - Analyze live PSX market data using a data science workflow - Create an analysis-ready dataset for EDA, insights, and ML - Build an interactive dashboard for market monitoring and learning ⚙️ Key Features - Real-time data extraction for all PSX listed stocks - Captures: OHLC prices, Volume, Change, % Change, Sector, Status, Time - Data cleaning & normalization (missing values, halted & low-liquidity stocks) - Feature engineering: - Market insights: - Interactive Streamlit dashboard for visualization and exploration - Exportable analysis-ready DataFrame / CSV 🧠 Technologies Used - Data Science (collection → cleaning → features → insights) - Python - Libraries: - Streamlit for real-time dashboard & visualization - Ready for EDA, technical analysis, and ML workflows ✅ Why This Matters This project shows how real-world PSX data can be transformed into meaningful insights and dashboards, handling the noise and constraints of an emerging market. If you want to learn, extend, or add ML on top of this, let’s collaborate 🤝
1
0
6h •
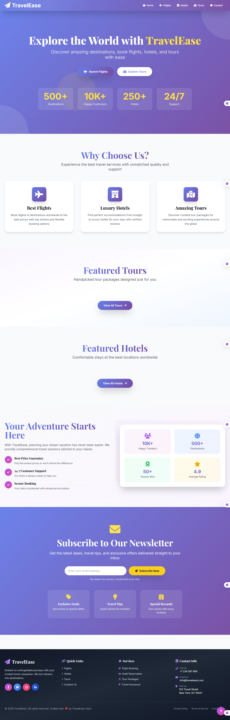
✈️ Introducing TravelEase: A Seamless website Built with Django
I’m excited to finally share TravelEase, a full-stack travel management platform I’ve been building! My goal was to create a high-end, "international-tier" experience that takes the stress out of planning trips. From browsing exotic destinations to booking luxury stays, TravelEase is designed with a Navy & Platinum professional aesthetic to give users that premium "concierge" feel right from their browser. 🛠 The Tech Stack - Backend: Powered by Django (Python) for robust data handling and security. - Frontend: Crafted with Tailwind CSS for a sleek, responsive, and professional UI. - Icons & Style: Enhanced with FontAwesome and Plus Jakarta Sans typography for a modern, "Apple-esque" finish. 🌟 Key Features - Smart Discovery: A refined landing page with curated "Elite Destinations" and "Featured Tours." - Dynamic Booking System: Integrated logic for Flights, Hotels, and Tours with real-time price updates. - Glassmorphism UI: A sticky, blurred navigation bar and interactive cards that react as you explore. - Responsive Design: Fully optimized for mobile—because travel planning happens on the go. - Personalized Experience: Django-powered messaging system for booking confirmations and updates. 💡 What I Learned Building TravelEase taught me how to handle complex relational databases in Django (linking Tours, Hotels, and Bookings) while maintaining a high-level frontend that doesn't sacrifice performance for beauty. I’d love to hear your thoughts on the UI or the architecture!
2
0

0 likes • 7h
Helpful post

22h •
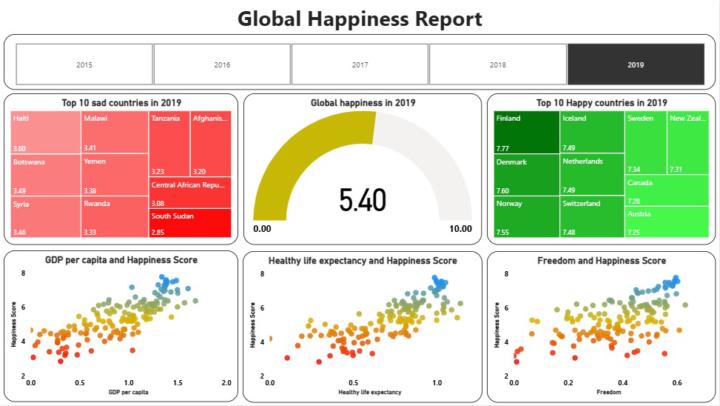
Data Analytics Project 25 : Power BI Global Happiness Report
Data Analytics Project 25 : Power BI Global Happiness Report This report analyzes well-being across countries by combining economic, health, and social indicators. This interactive dashboard focuses on 2019 data and enables a clear comparison of global leaders and laggards in happiness, helping uncover the key drivers behind overall life satisfaction worldwide. One of the main KPIs highlighted is the Global Average Happiness Score, which stands at 5.40 out of 10, visualized through a gauge chart. The dashboard also ranks the Top 10 Happiest Countries, led by Finland with a score of 7.77, followed by Denmark, Norway, Iceland, and the Netherlands. On the other end, South Sudan records the lowest happiness score at 2.85, emphasizing significant economic and social challenges. The report includes detailed correlation analysis using scatter plots. A strong positive relationship is observed between GDP per capita and happiness score, showing how economic prosperity contributes to well-being. Similarly, higher healthy life expectancy and greater personal freedom are both associated with increased happiness levels. Built using Power BI, Power Query, and DAX, this project demonstrates data modeling, ETL, KPI creation, and data storytelling skills. It showcases how data visualization can turn complex global data into actionable insights. Power BI Service Link : https://app.powerbi.com/view?r=eyJrIjoiYzA3Y2Y3NmQtYmQwOS00MWU3LTg5NDktZjlmY2QxM2E0M2FmIiwidCI6IjZlNTk3ZjY4LWM4YmEtNGI2Yi1hNTY3LTJlNjc3YTQ2ZTMwZCIsImMiOjl9 GitHub Link : https://github.com/Talal-Bin-Zahid/Power-BI-Global-Happiness-Report
0 likes • 7h
Keep moving bro, good job👏
1-10 of 14

@abul-hassan-8765
Computer Engineer (Passionate about AI) willing to connect with like minded to grow
Active 2h ago
Joined Dec 14, 2025