
Write something

3d •
How was PSX Session?
Did you guys like the Session on Pakistan Stock Exchange? Those who were unable to participate can view the recording in Class Room Section under Q&A Webinars

30d •
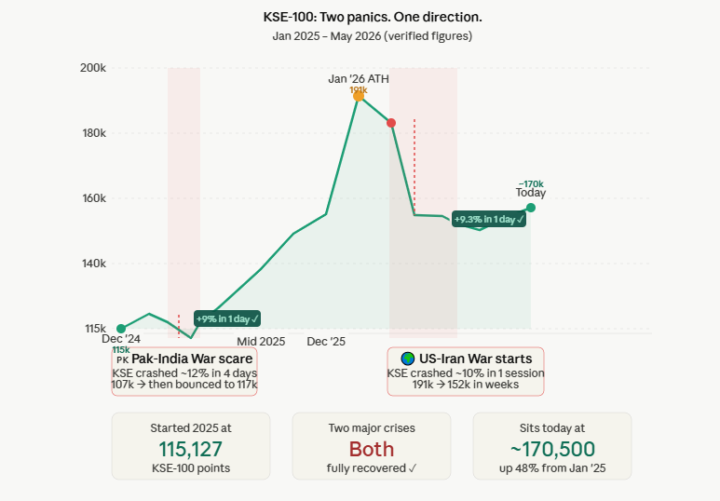
The KSE-100 survived two wars in less than 2 years. And it's still up 48%.
Here's the timeline: Jan 2025: Market starts at 115,127 points. May 2025: Pakistan-India war. Index crashes 12% in 4 days. Circuit breakers triggered. People panic-sell. Ceasefire announced. Next session? +9.2% in a single day. Jan 2026: New all-time high. 191,032 points. March 2026: US-Iran war breaks out. Strait of Hormuz blockaded. Oil hits $120. KSE crashes 16,089 points in one session, worst single-day drop in PSX history. Pakistan brokers a ceasefire. Next session? +14,137 points, biggest single-day gain in PSX history. Today ~168,100 points. Up 48% from where we started. Both times, the news was terrifying. Both times, the market felt broken. Both times, the people who acted on emotion lost. The people who acted on fundamentals won. This is the oldest principle in investing, and the hardest to follow: "Separate the noise from the signal." Noise is what's on the news. Signal is what's in the numbers: earnings, interest rates, macroeconomic direction, valuations. In both crashes, Pakistan's fundamentals hadn't changed. Rates were still falling. The IMF program was intact. Corporate earnings were solid. The signal was still bullish. Only the noise had turned deafening. Your daily practice: every time you feel the urge to make a move based on a headline, stop and ask one question: Has anything changed in the fundamentals, or just the sentiment? If only the sentiment changed, the answer is almost always: sit tight. Were you holding, selling, or buying during either crash? 👇

28d •
How to Know If a Stock Is Cheap or Expensive - P/E Ratio Masterclass
Most investors look at a stock, see the price, and think: "Rs. 50? That's cheap." Rs. 50 compared to what? Compared to yesterday's price? Compared to what their friend told them? Compared to a gut feeling? This is how money gets lost. Through buying without context. Here's the context every investor needs before touching a single stock. P/E Ratio. Two letters that separate guessing from investing. Let's forget stocks for a second. You're looking to buy a small shop. A general store in your neighbourhood. Shop A costs Rs. 10 lakh to buy. It makes Rs. 1 lakh profit every year. You'll get your money back in 10 years. Shop B costs Rs. 50 lakh to buy. It also makes Rs. 1 lakh profit every year. You'll get your money back in 50 years. Same profit. Completely different price. Which one do you buy? Obviously Shop A, unless Shop B is sitting on a main commercial road, has a loyal customer base built over 20 years, and is about to get a huge apartment complex built right next door. Then maybe Rs. 50 lakh makes sense. That logic, price versus what you're actually getting, is exactly what P/E ratio measures. P/E = Stock Price ÷ Earnings Per Share If a stock is trading at Rs. 100 and the company earns Rs. 10 per share, P/E is 10. You are paying Rs. 10 for every Rs. 1 this company makes. That's it. That's the whole concept. Now let's make it even simpler. Think of P/E as the number of years it takes to get your money back, assuming profits stay the same. P/E of 10? You recover your investment in 10 years. P/E of 30? Thirty years. P/E of 5? Five years. Suddenly that number means something real. "Okay so low P/E = good, high P/E = bad. Simple." Not so fast. Here's where most beginners make the mistake. Let's go back to shops. Your neighbour tells you about a shop selling for Rs. 5 lakh. Makes Rs. 1 lakh profit. P/E of 5. Sounds like a steal. But when you visit, the location is terrible, the manager just quit, and the owner is selling because a big superstore is opening right across the street next month.
20d •
How to read a company's Debt-to-Equity Ratio with real PSX examples
Debt-to-Equity ratio tells you one thing, whose money is running this business. Every business is funded by two sources: money the owners put in (equity) and money borrowed from others (debt). D/E shows the proportion between the two. D/E = Total Debt / Shareholders Equity A D/E of 1.5 means for every Rs. 100 of owners' money, the company has borrowed Rs. 150. More than half the business is running on borrowed money. But debt isn't always bad If a company borrows at 12% and earns 25% on that capital, it's generating wealth from borrowed money. That's called leverage working in your favour. The problem starts when earnings dip but interest payments don't. A highly leveraged company in a bad year can spiral fast: no slack, no cushion. Reading the number - 0 – 0.5 → Conservatively funded. Mostly owner capital. Stable but may grow slower. - 0.5 – 1.5 → Balanced leverage. Healthy in most industries. Growth funded sensibly. - 1.5+ → Heavily leveraged. Higher risk and reward. Context is everything. Always compare within the same industry. A D/E of 3 is routine for a power plant. The same number for a textile company is a red flag. PSX Examples: OGDC: D/E ≈ 0.23 (effectively zero for years) OGDC ran at zero debt from 2021 through 2024, four straight years of a completely clean balance sheet. No borrowing, no interest burden, operations funded entirely by its own capital. The small uptick to 0.23 in 2025 is worth watching but nowhere near concerning. At this level it's barely leverage, more likely project financing for a specific initiative rather than any structural shift in how the company funds itself. This is what a cash-generative, state-backed oil and gas giant looks like on a balance sheet. The risk here was never debt, it's always been oil prices and circular debt from the government side. The D/E tells you OGDC doesn't add financial risk on top of that. That's the right call. LUCK: D/E ≈ 0.54 Lucky Cement peaked at a D/E of 1.12 in 2022, that was deliberate. They were mid-expansion: new plants, Lucky Electric, Lucky Motor all scaling simultaneously. They borrowed to build.

22d •
The 20-Minute Habit That Separates Investors from Gamblers
Everyone wants to find the next big stock. Nobody wants to read a balance sheet. And that's exactly why most people lose money. When you're buying a house, you don't just drive past it and say "looks nice, I'll take it." You check the structure. The water supply. Whether the neighborhood is actually appreciating or quietly declining. But with stocks? People see a rising price, a confident friend, and they're in. They buy the wall, without checking the foundation. Fundamentals are simply the answer to one question: Is this business actually healthy? Not is it popular, trending, or someone on YouTube say it's going to 10x. Is. The. Business. Healthy. A company can look incredible on the surface, and be completely hollow underneath. Debt piling up quietly. Margins shrinking every quarter. Cash running out faster than profits are coming in. Fundamentals are what separate the person who saw the crash coming from the person who was shocked by it, even though both were watching the same stock. Here's the beautiful part though. You don't need a finance degree. You don't need to read 300-page annual reports. You need to understand maybe 8 to 10 core concepts: ratios, margins, cash flows, and you will instantly see more than 90% of the people trading in the market today. That's not an exaggeration. Most retail investors operate on vibes. You, with even basic fundamental knowledge, are already playing a different game. The market in the short term rewards hype. In the long term, it always rewards fundamentals. Every single time. We're breaking down these concepts one by one. Price to earnings ratio is done. Let us know which one you want to learn next. Because understanding one ratio properly can save you from one catastrophic mistake. And in investing, avoiding catastrophic mistakes is the strategy. Drop your vote, whichever wins, we break it down next with a real PSX example.
Poll
11 members have voted
0
0

1-9 of 9

skool.com/sarmaayaskool
A private community by Sarmaaya to help people build wealth, master money, and achieve financial freedom with guidance, clarity, and accountability.
Leaderboard (30-day)
1

+66
2

+61
3

+55
4

+37
5

+26
Powered by