
Write something
Pinned

Aug '25 •
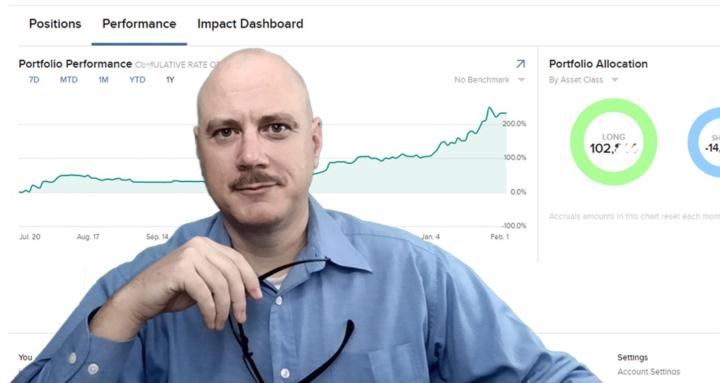
Current Positions
This my Current Positions and a few things I'm watching. https://www.tradingview.com/watchlists/165444406/ IBD - M. Minervini Style Screen https://www.tradingview.com/screener/qdGFSpm0/ Dividend Kings AND Revenue Growth https://www.tradingview.com/screener/wXskwyoU/ Baggers Style Screen https://www.tradingview.com/screener/EqZ0JnSz/ Free CashFlow Screen https://www.tradingview.com/screener/H6mKQWLz/ I use this software, mostly. https://www.tradingview.com/?aff_id=142103 I use this Remote Server to move trading off my PC into the Cloud https://www.quantvps.com?via=79ef81

Jul 26 •
Your options backtest is lying to you
I'm honestly shocked by how easily traders get seduced by backtests. Tools like OptionsOmega, OptionStack, eDeltaPro are curve-fitting machines. Tweak delta, move DTE, change width, entries, exits and filters until the curve finally behaves. There is no mathematical reason a cherry-picked in-sample curve should predict future returns. Test 45 independent variations of a strategy with zero real edge and the expected best Sharpe already lands near 1.0. Test 1,000 and it rises to 1.46. Bailey, Borwein, Lopez de Prado and Zhu showed mathematically how selection alone manufactures "alpha." I ran the formula myself. Zero edge. Options are even dirtier. Duarte, Jones and Wang found microstructure biases exceeding 50 basis points per day in some option-return estimates. Yet the backtest assumes you traded at the midpoint. That is why NOBODY from the OptionsOmega crowd has EVER replicated those backtests with transparent live results. Think about it. Post the live account next to the backtest. I'll go first. P.S. Here's a second problem I skipped above. A paper accepted at The Review of Financial Studies found that many options backtests quietly throw out price quotes that look wrong, using information nobody had at the time of the trade. The tool curve-fits your entries. It also cheats on your fills. P.P.S. This is why, in our hedge fund, we don't use retail tools like these in the way they're advertised. There's a much smarter process for researching these strategies, closer to how it gets done at the institutional level. Happy to get into that in the comments if people want it. Has anyone here found a vendor, in this space or elsewhere, that puts live results next to the backtest instead of just the curve?
1
0

Jul 18 •
I simulated TQQQ back to QQQ's 1999 launch
Many people here trade options on leveraged ETFs. I simulated TQQQ back to QQQ's inception in March 1999, with financing costs and the fund's expense ratio built into the model. Almost every leveraged ETF discussion eventually runs into assumption 3x daily leverage should produce something close to 3x the long-term return. The pre-2010 series models 3x daily exposure to QQQ, with financing costs on the borrowed notional and the fund's expense ratio subtracted daily. Starting in 2010, the simulated series is spliced directly into TQQQ's real, traded adjusted price history, so everything after that point comes from actual market data. The results, $10,000 invested in March 1999: - QQQ: $10,000 → $167,265 (11% annualized) - TQQQ (simulated pre-2010, real data after): $10,000 → $24,569 (3.4% annualized) Maximum drawdown over the same 27 years: - QQQ: -82.96% - TQQQ: -99.98% A -99.98% drawdown means every $10,000 fell to $2. TQQQ carried far more risk the entire way and still finished with $14,569 in total profit against QQQ's $157,265, under 10% of the unleveraged return. The volatility drag (beta slippage) scales with the square of the leverage multiple. So double the leverage and the drag roughly quadruples, triple it and the drag runs close to nine times larger. That is why I don't trade options on leveraged ETFs. You would be layering theta and IV risk on top of an instrument that is already decaying by design and has never been tested by the environment that would break it.
1
0

Jul 15 •
Using This Week's Earnings Volatility to Buy REITs for Retirement
Since 1991, REITs and the S&P 500 have delivered almost the same total return, but the engine was completely different. Most options traders never notice this. REITs are boring. Theta is not. I used this week's earnings-volatility spike to get paid extra for buying real estate at my price, instead of whatever price the market hands me on a random Wednesday. Active trading builds the war chest. Boring trades like this help build your net worth. You need both.
1
0

Jul 8 •
It's Just Sector Rotation
Hi, something happened over the last 24 hours that's such a clean example of rotation, I wanted to write it down while it's still fresh. Yesterday, money crowded into the biggest tech names in the market. The Nasdaq still closed red on the day, but the mega-cap tech ETF finished up close to 2%. Defensive sectors like healthcare and utilities actually lost ground. Even on a day that closed red, capital was clearly picking favorites inside the selloff. Then today flipped the entire script, Trump told NATO the ceasefire with Iran is over, oil jumped more than 6%, almost every sector turned red (except energy and consumer staples), even yesterday's tech winners gave it all back. That's rotation in its purest form: capital finding whatever feels safest at that exact moment, sitting there, and moving again the second the story changes. Anyone else watching this play out today? What you're doing differently because of it?
1
0

1-30 of 98
powered by
skool.com/painlesstraders-8746
I've been trading for twenty years, I'll share my experience.
Suggested communities
Powered by