Activity
Mon
Wed
Fri
Sun
Jun
Jul
Aug
Sep
Oct
Nov
Dec
Jan
Feb
Mar
Apr
What is this?
Less
More
Memberships
SAT Prep
16.7k members • Free
⭐️The Skool Hub⭐️
5.3k members • Free
Superior Students
21.8k members • Free
ConstruPRO
372 members • Free
Data Career Network
103 members • Free
69 𝓒𝓸𝓶𝓮 𝓐𝓵𝓲𝓿𝓮 💖
69 members • Free
SQL Answers - Data & AI
287 members • Free
Everyday Analysts Hub
146 members • Free
Python Developers
1.2k members • Free
55 contributions to The Energy Data Scientist

11d •
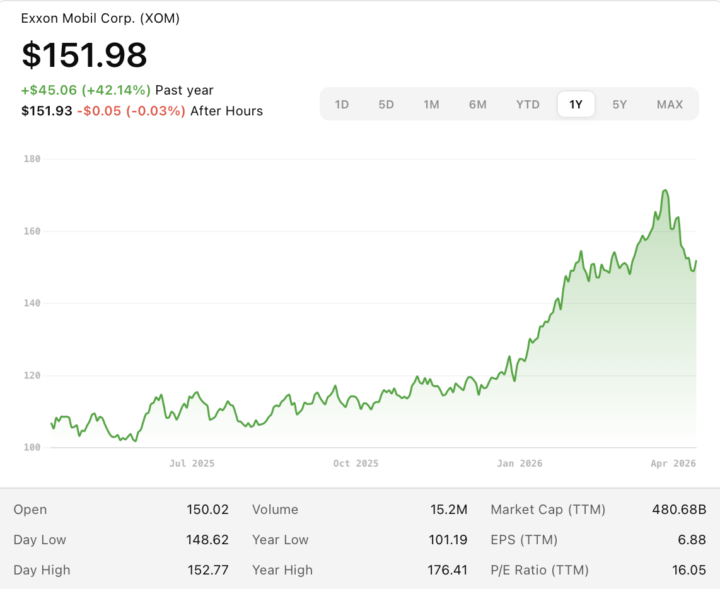
Portfolio Manager on Exxon Stock
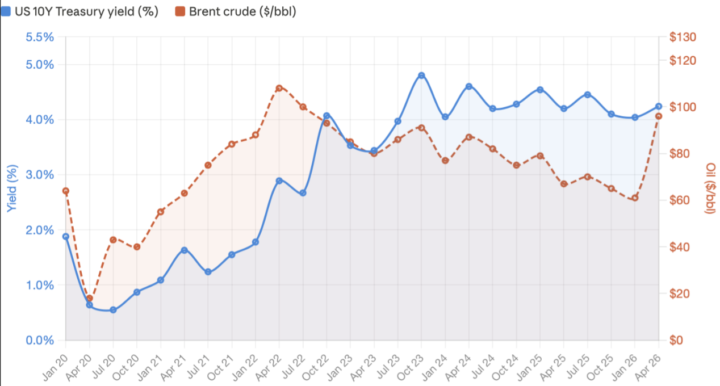
Was chatting with a portfolio manager on the Exxon stock price. See plot which is here attached. It shows Exxon Mobil’s stock price (XOM) over last year until now. XOM is the ticker symbol for Exxon Mobil on the New York Stock Exchange. On 28 February the US and Israel struck Iran, and because roughly a fifth of global petroleum consumption passes through the Strait of Hormuz, markets instantly priced in a supply disruption and so Brent jumped about 43% in March. XOM tracked it almost tick-for-tick. XOM tracks Brent very closely. See that the stock was relatively flat for much of 2025, then rose sharply in early 2026, and later pulled back a bit. So at some point, the market became much more positive about Exxon, likely because of stronger oil and gas expectations. See for example the second attached plot . The blue line is Exxon Mobil’s stock price, and the orange dashed line is Brent crude oil. Before late February, both move around, but nothing dramatic happens. Then, around Feb 28, both jump sharply: Brent rises from about $70 to about $104 per barrel, and Exxon jumps to a March peak of $176.41. After that, both come down. So the message is that a geopolitical shock pushed oil prices up quickly, and Exxon’s stock moved up with it. When oil goes up fast, investors expect a company like Exxon to earn more cash, so the stock price also rises.

1 like • 10d
Planning courses for aspiring Portfolio Managers ?
12d •
Bond yields & Oil prices - interviews
Attached is an Interesting and useful plot to know for any interviews in the finance/energy space. It has become quite popular. It is a popular plot that shows how the US Treasury yield moves with Brent Crude oil price. Specifically: - The US government (its Treasury Department) borrows money by selling bonds to raise cash for things like defence, infrastructure, and social programs. It borrows from anyone willing to buy those bonds e.g. from China and Japan, the Federal Reserve, US banks, pension funds, mutual funds, hedge funds, and even individuals. One of these bonds is the US 10-year Treasury. And its yield is what the US government pays to those who bought the bond (and so lent the government money for 10 years). So if you buy a $1,000 bond with a 4% yield, you get roughly $20 every six months (that's $40/year), and then at the end of the 10th year you get your original $1,000 back. That's why bonds are attractive to pension funds and retirees — they provide a steady, predictable income stream, not just a lump sum at the end. - and the price of Brent crude oil : There are two main oil benchmarks: Brent (from the North Sea) and WTI (West Texas Intermediate, the US domestic benchmark). Brent is the one that matters globally as 65% of all internationally traded oil is priced off Brent. So when they say "oil is at $96 a barrel," they usually mean Brent. The reason everyone cares is that oil feeds into the cost of almost everything. It's petrol at the pump , it's the cost of shipping goods, manufacturing plastics, heating homes.... When oil goes up, the price of basically everything follows, which is inflation. We see how these two tend to move together : when oil gets expensive, it makes everything else more expensive too (inflation), and investors then demand higher yields to lend money because they want to be compensated for that inflation eating into their returns. E.g. in the 2020 pandemic both collapsed. In the 2021–22 recovery both surged.
18
0

13d •
New Course: Fundamentals of Energy Economics for Electricity Grid Planning
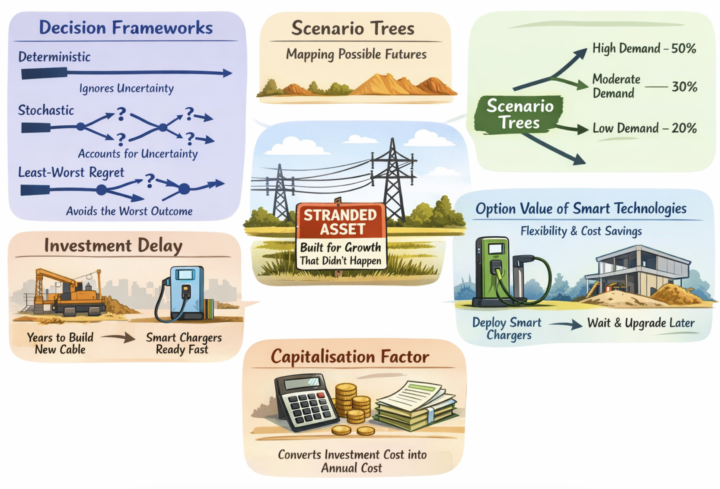
Just released a new course on energy economics, covering important economic concepts behind investment decisions in electricity distribution networks. You'll learn about - decision frameworks (deterministic, stochastic, least-worst regret), - scenario trees, - stranded assets, - option value of smart technologies, - investment delay. All concepts are illustrated through a practical example. No prerequisites. Ideal if you're preparing for energy economics or power system economics roles, or doing research. It is course 120 at the very end of the Classroom. Briefly here are the definitions of fundamental economic concepts in power systems: - Decision frameworks: these are approaches that network planners use to decide where and when to invest in power systems. These frameworks are: deterministic (ignores uncertainty), stochastic (accounts for uncertainty and probabilities), and least-worst regret (accounts for uncertainty but not probabilities). - Scenario trees: A way to map out possible scenarios. Demand might grow a lot, a little, or not at all. The tree captures these paths and their probabilities. - Investment delay: Some investments take longer to build than others. Upgrading a cable might take years; deploying smart chargers can happen faster. This difference matters hugely for planning. - Stranded assets: You invest in upgrading a line expecting electricity demand to grow, but it doesn't. Now you've paid for capacity nobody uses. That's a stranded asset. - Option value of smart technologies: Smart technologies like smart chargers can be deployed quickly, letting planners wait and see how uncertainty plays out before committing to expensive upgrades. The cost savings from having this flexibility is the option value. - Capitalisation factor: Converts a one-off investment cost into an equivalent annual cost, accounting for the asset's lifetime and the discount rate. Attached is a summary slide, and a slide on the concept of option value and stranded assets. No need to fully understand these screenshots . Just to get an idea of what the course teaches.
1 like • 12d
Very important economic terms.
Feb 24 •
New Online Course: Stochastic Optimization
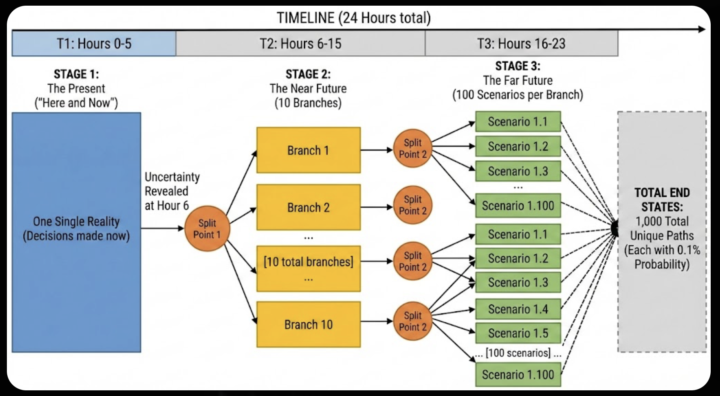
Inside the 'Classroom' , there is a new course (116) , which shows how to develop, in Python, a 2-stage and a 3-stage stochastic optimization model. The code is available for download, and it is explained through a video of about 1 hour in total. The prerequisites are courses 115 (deterministic optimization) and 116 (Monte Carlo). Stochastic Optimization is used a lot in energy, economics and finance. Anytime we have something uncertain, we use scenarios to describe how the future may play out. For example, the electricity demand tomorrow can be 100 kW, 50kW, 20kW. So we have 3 scenarios. We can have as many scenarios as we think is reasonable. For example in the code we build a 'scenario tree' consisting of 1000 scenarios. And we then assign a probability to each of these scenarios. Then, we have an objective function, which includes probabilities. We have constraints. And this is like any other optimization model. We call it 'stochastic' because it has probabilities in the objective function and because it has scenarios. It is like any other optimization model. So , the jargon may sound a bit intimidating , but it is very simple actually. We apply stochastic optimization to a smart building, which has a solar Photovoltaics unit and also it has residents who consume electricity (electricity demand). And we want to minimize the daily cost of operating this smart building in the future. Since we want to 'minimize' something' we speak about 'optimization'. And also we have uncertainties: the electricity demand is uncertain. Also, the output of the solar PV unit is uncertain. See the two screenshots attached for some extra context.
1 like • Feb 26
One of the most important skills to have in energy (and economics/finance)

Feb 24 •
Power Market Modelling Consultant
Hi, im new here, and recently taking the course to understand energy analytics. Ive been having a look around on linkedin at some jobs as a junior can get into. theres a role for "Power Market Modelling Consultant" - Here is a snippet of their requirements.. What You’ll Be Doing - Building and running market models to explore price evolution, dispatch patterns, capacity dynamics, and policy impacts. - Applying tools such as PLEXOS, Python, R, and advanced spreadsheet modelling to deliver evidence driven insights. - Supporting economic and regulatory assessments, including evaluating future energy scenarios and system wide implications. - Communicating complex findings clearly to internal teams and external stakeholders. - Working with multidisciplinary colleagues on projects for government, industry, and energy ecosystem organisations. About You - A good understanding of UK or European electricity markets, system operation, and market drivers. - Experience using PLEXOS or similar modelling environments, plus familiarity with scripting or statistical tools. - A background in energy modelling, forecasting, simulation, economics, or related analytical fields. - Excellent communication skills, collaborative mindset, and the ability to translate complex modelling outputs into clear messages. can someone just explain what type of knowledge i would require for a job like this? i have general python, sql, excel knowledge so trying to transfer into energy analytics. or can someone recommend some junior analyst roles i can do instead or what the job spec will look like? im just trying to understand, what type of things i should be focusing on. Would really love everyones input.
0 likes • Feb 26
Good luck if you start applying soon. Share any updates anytime. And I fully agree with the above also.
1-10 of 55

@paul-e-adams-phd-8694
MEng. Aiming for PhD. Software Engineering
Active 10d ago
Joined Sep 13, 2025
ESFJ
Wales