Activity
Mon
Wed
Fri
Sun
May
Jun
Jul
Aug
Sep
Oct
Nov
Dec
Jan
Feb
Mar
Apr
What is this?
Less
More
Memberships
New Life NZ
42 members • Free
The Energy Data Scientist
618 members • Free
AndyNoCode
32.4k members • Free
AI SAAS Builders (Workshops)
4.9k members • Free
Plan Your Tech
118 members • Free
Kickstarter Challenge
26.4k members • Free
Real Men Real Style Community
13.5k members • Free
salesreps.com
327 members • Free
Kourse (Free)
113.1k members • Free
8 contributions to Brendan's AI Community

Sep '25 •
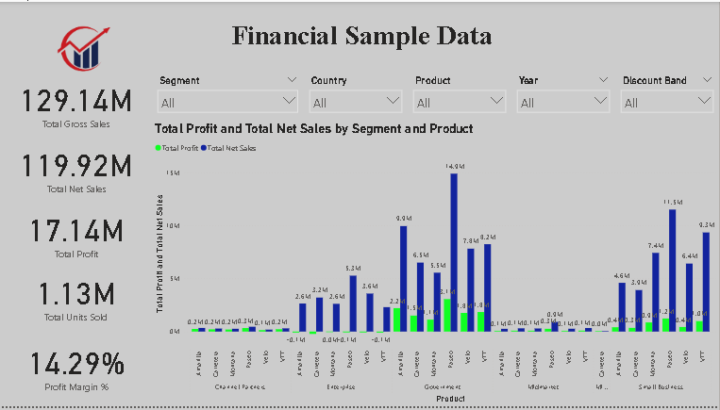
Financial Sales & Profitability Dashboard (Power BI)
🔹 Business Problem Addressed Organizations struggle with tracking the financial impact of discounts, understanding profitability across segments, and identifying growth trends. This project focused on creating a finance-ready dashboard to provide actionable insights into sales performance, cost management, and profit margins. 🔹 Key Metrics & Insights Total Sales, Net Sales, Gross Sales – revenue tracking Profit & Profit Margin % – profitability evaluation Discounts Impact – revenue leakages due to discounting Units Sold – demand measurement Trend Analysis (Year-Month) – seasonality and growth Segment, Product, and Country breakdowns – performance analysis across business dimensions 🔹 Visualizations & Reasoning Cards (KPIs): Quick overview of Sales, Profit, Units, Profit Margin. Waterfall Chart: Shows flow Gross Sales → Discounts → Net Sales, highlighting discount impact. Clustered Column Chart: Compare Sales & Profit by Product/Segment. Scatter Plot: Correlation between Discounts vs Profitability. Line Chart (Trend): Detect growth or seasonality in Sales & Profit over time. Treemap/Matrix: Identify top-performing products by sales/profit. Map: Geographic performance by country. 🔹 Design Enhancements Consistent colors: Blue for Sales, Green for Profit, Red for Discounts. Data labels for readability. Segmented layout: KPIs (top row), Product/Segment (middle), Trends & Geo (bottom). Clear narrative: from overall performance → drivers of profit → actionable insights. 🔹 Narrative / Business Story The dashboard revealed that discounts significantly reduce net revenue, with certain products/segments contributing more profit than others. Profitability varied across geographies, and trend analysis exposed seasonal fluctuations in sales. 👉 Business Action: Optimize discounting strategies, focus on high-margin products, and leverage seasonal demand patterns for better financial outcomes. 🔹 Impact 📈 Delivered a clear financial picture linking sales, discounts, and profit.
0
0

Sep '25 •
Dev Partner
Looking for a Developer to partner with me for my company. I will take care of the marketing and sales, just need someone who's willing to build the AI solutions. I'm looking for someone to partner with rather than a freelancer. If interested, send me a dm and some builds that you've done already.
0 likes • Sep '25
Find clients I am Power Bi developer Its Every company needs and trends So finds clients i will work with you
0 likes • Sep '25
Give me what type of project you Need I make its

Sep '25 •
Still manually juggling UGC, leads, and payments?
That chaos is costing you time and money. I helped [Creator Name] automate lead collection + follow-ups using AI, and their response rate jumped 42% in just 3 days. Another client went from 20 hours/week of admin work to just 2 hours/week—all automated. I help founders & creators turn messy processes into smooth AI-powered workflows—UGC, lead gen, data, payments so you can focus on growth, not busywork. If you want to see similar results in your business, DM me and I’ll show you a simple workflow that can start saving you hours this week.
0 likes • Sep '25
@Sheriff Digital Dear Member Can i talk with you can i share my project with you just send one DM
Sep '25 •
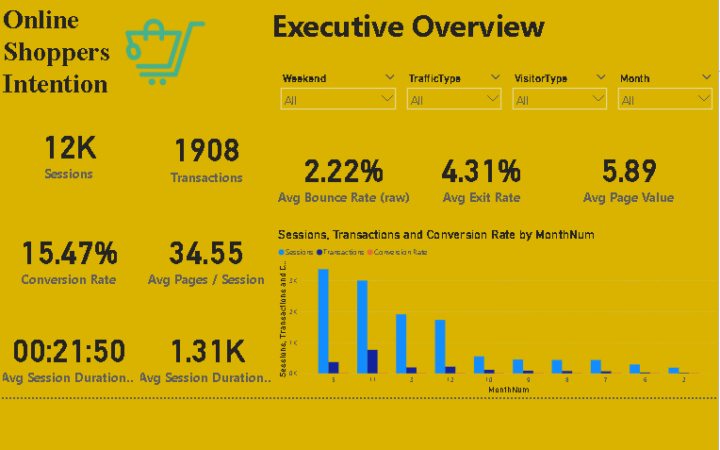
📊 Online Shoppers Purchasing Intention – Power BI Report
This Power BI report analyzes e-commerce user sessions to uncover patterns in purchasing behavior. The dashboard includes: - KPIs: Sessions, Transactions, Conversion Rate, Avg Pages/Session, Avg Duration - Engagement Metrics: Bounce Rate, Exit Rate, Page Value, Engagement Score - Trends & Insights: Monthly session & conversion trends, traffic source performance, visitor segmentation (new vs returning), weekend & holiday effects - Technology Analysis: Browser, OS, and region-wise engagement ✅ Built with data cleaning in Power Query, a star schema model, and custom DAX measures for conversion and engagement. ✅ Designed for interactive decision-making to help optimize marketing channels, user experience, and sales strategy.
0
0
Sep '25 •
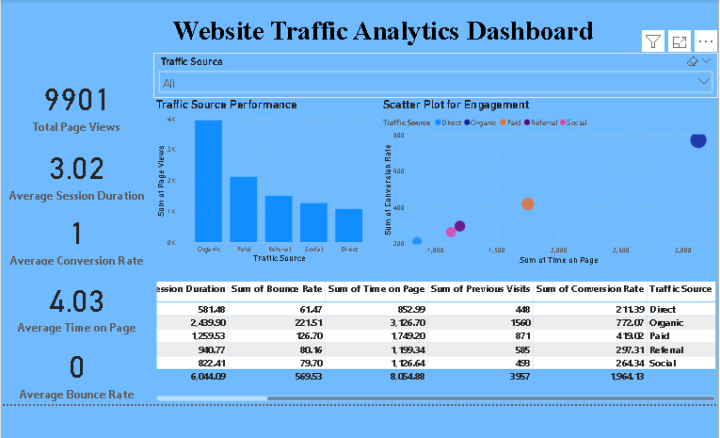
Website Traffic Analytics Dashboard | Power BI Project
Hi everyone, I’ve created a Power BI dashboard analyzing website traffic and user engagement. This dashboard helps visualize key metrics such as: - Page Views - Session Duration - Bounce Rate - Time on Page - Previous Visits - Conversion Rate It also includes interactive visuals like KPI cards, bar charts, scatter plots, and tables, which allow you to easily identify high-performing traffic sources and user behavior trends. You can use this dashboard to monitor website performance, analyze user engagement, and optimize conversions. I’m sharing it here for feedback and learning—feel free to check it out and share your thoughts!
0
0
1-8 of 8

@muhammad-affaf-9775
I am Business Analysis Complete my project and course looking for a work
Active 13d ago
Joined Aug 30, 2025
Karachi Pakistan
Powered by