
Write something

6h •
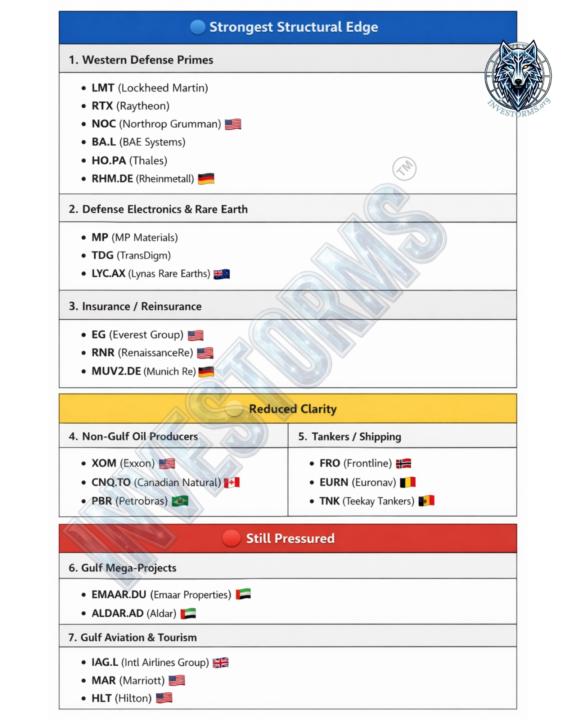
Real-Time Macro Case Study: Conflict & Recovery Timelines
Understanding this material will help you understand why the market reprice and for how long. In the comment section you'll find a list of stocks that are mostly affected positively and negatively. Yesterday we mapped recovery assuming hostilities stopped. Today, that assumption weakens. In the last 24 hours, strikes have shifted toward "economic arteries", not just military targets. For investors, this is not a tactical detail -- it changes the pricing model. Here is what worsened in only 24h. 🛢️ Energy Infrastructure -- Timeline Risk Expands Yesterday: weeks to 6 months. That still applies to repairing oil fields and refineries. What changes is the "export layer". With ports hit and the Strait of Hormuz effectively disrupted: • crude may be produced • but shipments bottleneck • insurance pricing spikes • LNG cargoes face delay or rerouting Production recovery ≠ export normalization. From a market perspective: • the geopolitical risk premium in oil becomes stickier • volatility increases • forward curves steepen under uncertainty • refiners and import-dependent economies face margin pressure If maritime disruption continues, energy pricing reflects logistics stress -- not just supply capacity. --- 🛰️ Military & High-Tech Systems — Stabilization Delayed Yesterday: 3 to 5 years for full rebuild. Now add another constraint. Key allied bases responsible for securing sea lanes and reopening trade corridors have been targeted. Reduced stabilization capacity means: • maritime security risk remains elevated • shipping costs stay inflated • insurance markets remain tight • trade normalization slows For capital markets, this extends: • defense spending cycles • supply chain bottlenecks in aerospace • rare earth and component pressure The bottleneck is no longer only manufacturing --it is operational control. --- 💰 Economic Confidence — Confidence Shock Intensifies Yesterday: 5 to 10 years. New developments directly hit: • Dubai’s aviation hub • commercial ports
0
0
1d •
Middle East Macroeconomy Projection
In the comments section I will add which investments can potentially profit or suffer. If war in the Middle East stopped today, the Gulf would recover — but not uniformly. Full recovery separates into three timelines: • energy infrastructure • military and high-tech systems • long-term economic confidence The region has deep capital reserves. What it does *not* control is global supply chain friction. Here is the realistic recovery map. --- 🛢️ Energy Infrastructure Estimated timeline: weeks to 6 months This is the fastest-moving layer. There is clear precedent. After the September 2019 strikes on Saudi Aramco’s Abqaiq and Khurais facilities — which removed ~5.7 million barrels per day — production capacity was largely restored within weeks. Structural advantages: • highly standardized oil infrastructure • large domestic spare-parts inventories • centralized state operators (Aramco, ADNOC) • sovereign wealth funding with no financing delays Important exception: Qatari LNG liquefaction trains are more specialized and less easily substituted. Recovery there likely trends toward the **upper end of the window**. Assessment: Oil flows normalize relatively quickly. --- 🛰️ Military and High-Tech Systems Estimated timeline: 3 to 5 years This is the primary bottleneck. Physical cleanup of bases can occur quickly. Rebuilding the integrated defense and intelligence architecture cannot. Hard-to-replace assets include: • advanced radar systems • air defense networks • satellite communication hubs • specialized command infrastructure Constraint: Western aerospace and defense manufacturers are already operating with multi-year backlogs and tight rare-earth supply chains. Capital is abundant. Production capacity is not. Assessment: Defensive capability restoration is measured in years, not months. --- 💰 Economic Confidence and Capital Flows Estimated timeline: 5 to 10 years This is the slowest variable and the least visible in early headlines. Over the past decade, Gulf economies — particularly the UAE and Saudi Arabia — have positioned themselves as stable, globally integrated investment hubs under programs such as Vision 2030.
3d •
Update: Gold Outlook Feb 28th 🎯Target Hit
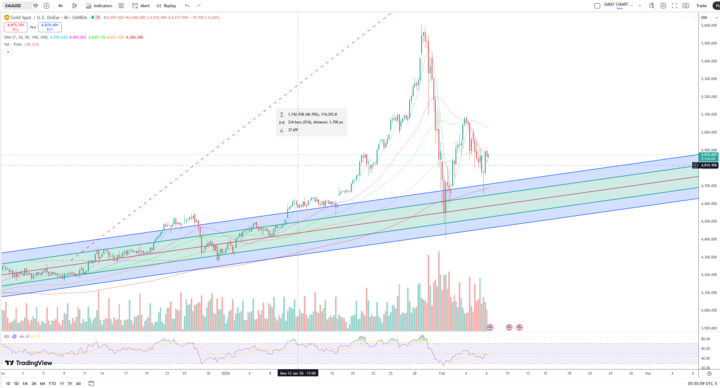
In our February 5th outlook, we mapped out the next critical zone to watch for Gold: 5530 - 6000. Today, that target was officially hit. Today’s big move was triggered by the war in the Middle East, but make no mistake the conflict was not the root cause. You will often hear mainstream analysts scrambling to explain a market move simply because something big happened in the news. We strive at Investorms to make you not think superficially. News events only confirm and accelerate the structural market moves that have been building quietly for years. Short-Term Noise vs. Long-Term Clarity - The Short Term (Unpredictable): Immediate price action from here is erratic. We could very well see a quick drop on Monday just to close the price gap left open since Friday. - The Intermediate to Long Term (Unquestionable): For our active trading positions, we are focused on intermediate to long-term profits. Looking at the larger cycle, it is almost unquestionable that we will break upward to set a new All-Time High. We will highlight the created pattern in a later updates. Important Note: Our posts are strictly for educational purposes and do not constitute trading advice.
23d •
Bitcoin market updates
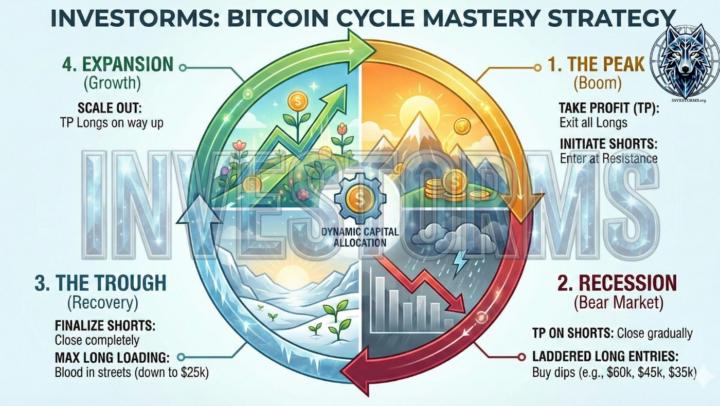
Bitcoin has corrected 50% from its $126,210 peak in October 2025. This part belongs to the advanced lessons, but sharing now because some opportunities does not happen twice in a lifetime. We are currently testing the 200-week moving average ($60,000), the historical floor for every major cycle. Market sentiment is pinned at 5/100, signaling extreme fear. Laddering buys at $60k, $45k, $35k, and $25k is a strategy for absorbing the "final flush". While the crowd sees a collapse, this is a systematic accumulation of exhausted supply. Investorms strategy aim for profit targets of 300%–400% rely on a return to price discovery, though on-chain data warns that institutional distribution is not yet complete. The "how to do" for beginners and the specific liquidity mapping for advanced traders also the mechanics of converting short profits into long positions will be shared with the full strategy and execution methods once there is enough people who can profit in here.
1
0
26d •
Gold Outlook Feb 5th
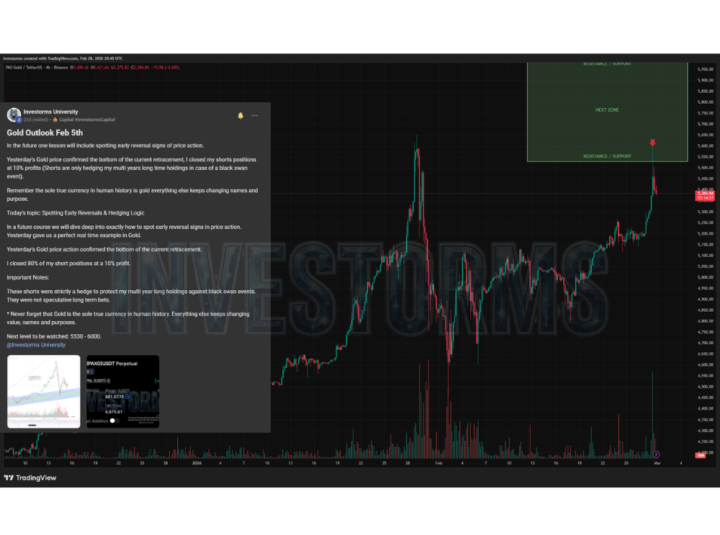
In the future one lesson will include spotting early reversal signs of price action. Yesterday's Gold price confirmed the bottom of the current retracement, I closed my shorts positions at 10% profits (Shorts are only hedging my multi years long time holdings in case of a black swan event). Remember the sole true currency in human history is gold everything else keeps changing names and purpose. Today's topic: Spotting Early Reversals & Hedging Logic In a future course we will dive deep into exactly how to spot early reversal signs in price action. Yesterday gave us a perfect real time example in Gold. Yesterday's Gold price action confirmed the bottom of the current retracement. I closed 80% of my short positions at a 10% profit. Important Notes: These shorts were strictly a hedge to protect my multi year long holdings against black swan events. They were not speculative long term bets. * Never forget that Gold is the sole true currency in human history. Everything else keeps changing value, names and purposes. Next level to be watched: 5530 - 6000. @Investorms University
1
0
1-6 of 6

skool.com/investorms
Become a macro analyst 📈
• Master technical analysis
• Execute with precision 🎯
• Decode market myths
Old-fashioned investors are bleeding money 💰
Leaderboard (30-day)
1

+1
2

+1
3

+1
4

+1
Powered by