Investorms
Private
15 members
Free

From Paycheck Prisoner to Wealth Builder.
You're smart. You work hard. So why does wealth feel impossible?
Because school taught you to be an employee. Not a wealth builder.
At Investorms we fixe that. 📜
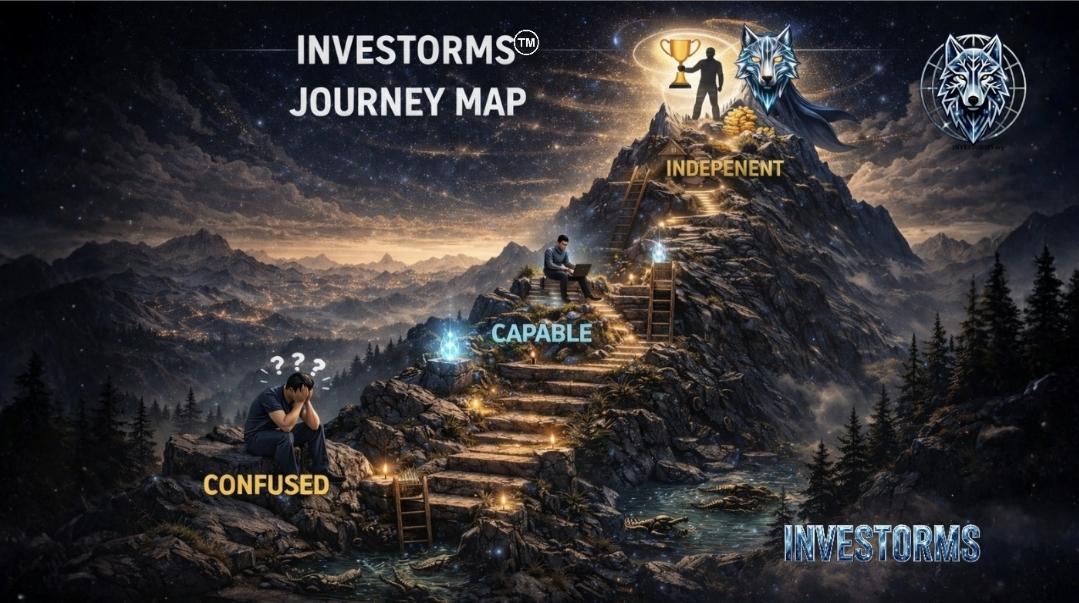
Inside Investorms,
you'll master the 3 phases of financial independence:
🔍 UNDERSTAND:
See how money actually works.
💰 EARN:
Build income that doesn't depend on your time.
📈 GROW:
Learn to trade markets and grow your money.
Today is FREE, Lock in lifetime access!
This isn't "get rich quick."
This is "finally master how money works."
Join now &
Welcome to Investorms.
skool.com/investorms
Become a macro analyst 📈
• Master technical analysis
• Execute with precision 🎯
• Decode market myths
Old-fashioned investors are bleeding money 💰
Powered by