
Write something

🔥
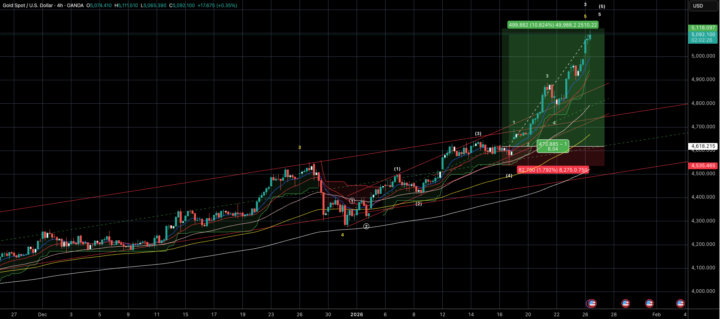
12h •
Gold - The Week Ahead
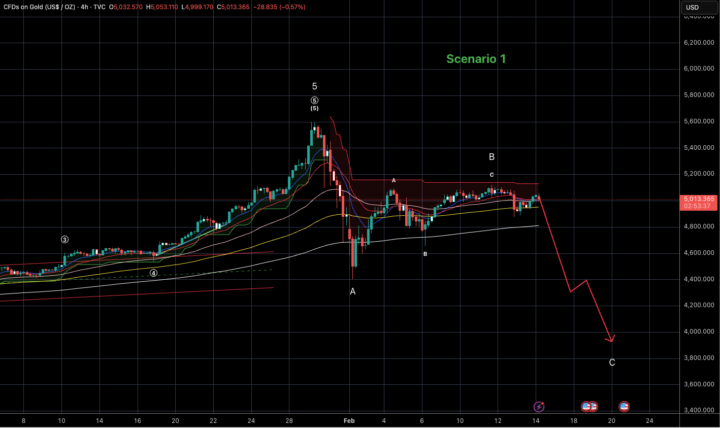
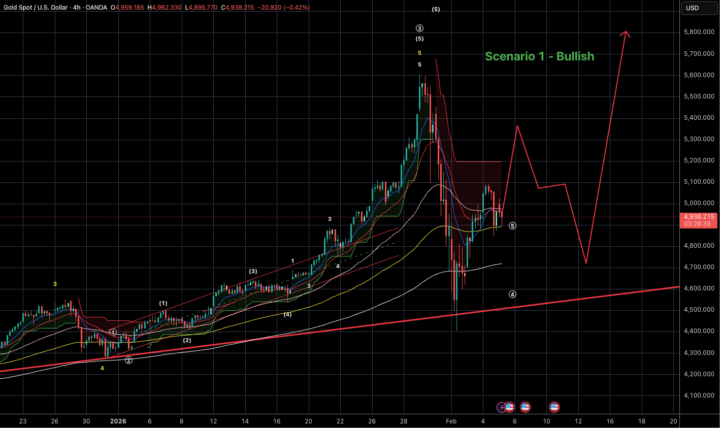
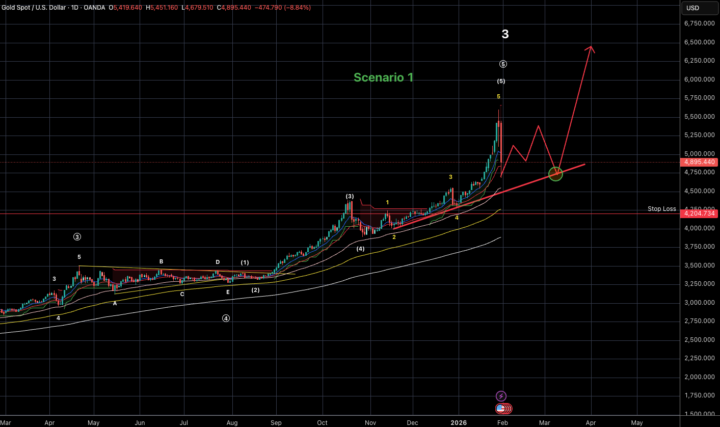
Date: 16/02 We're looking at an interesting week ahead in Gold. The charts are wide open to interpretation at the moment. As difficult as it may be, now is a time to be on the sidelines and wait for clarity to emerge so that we can act confidently instead of letting price action prove our different trades wrong. We're going into the week with 3 very possible and valid scenarios that are playing out in Gold at the moment. I will share the 3 scenarios below Scenario 1 - This scenario indicates that Gold is still currently in its corrective phase. It seems to be undergoing a regular ABC corrective with the current pullback (H - 5119) having completed Wave B and our last leg of Wave C having already begun with targets of 4000 - 3800 looking likely. This Scenario stays valid as long as the high of 5119 remains intact. Although I DO NOT recommend shorting Gold - the high of 5119 is to be used as an invalidation for this theory and can hence be used as a stop loss for any short position being created with this scenario in mind. Scenario 2 - This scenario also indicates that Gold is in a corrective phase. It would also show that Gold has gone into a complex corrective structure with Wave B getting extended time wise. This structure breaks the corrective down even further and shows Wave B being played out in a ABC corrective itself. These kind of corrections are usually drawn out time wise and often come after big and quick rallies. Here we are currently sitting in Wave b of B with another up move passed the recent high of 5119 needed to actually conclude the pullback wave before the final down leg (Wave C) begins. I personally would not recommend trying to play out or catch these waves but instead to wait and see how closely gold follows this pattern giving us a great opportunity to enter when Wave C concludes. Scenario 3 - The only bullish scenario that I can currently see on the charts. This scenario indicates that the corrective has completely ended at 4402 and the price action is already laying its foundation for the next rally upside. For this scenario to hold true - gold must not breach the previous swing low of 4654. This scenario would come much more into strength if price action breaches the current swing top of 5119 while maintaining the SL of 4654. This would show a structural shift that indicates that a bullish momentum could be building and that the corrective could in fact be over.

4d •
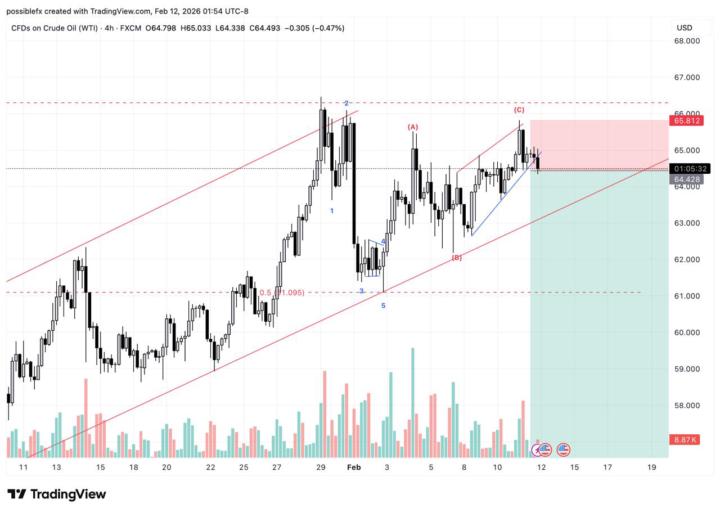
#USOIL
Oil completed a 5-wave impulse down followed by an ABC correction, with wave C printing a terminal ending diagonal. The break of the diagonal + impulsive wave 1/2 and now taking out wave 1 highs confirms a momentum shift. This looks like the beginning of a new impulsive sequence, not just a bounce. Watching for continuation and clean structure on lower timeframes. 🔥
🔥
11d •
Gold Update
Date: 05/02 Just dropping a short update as to what the possibilities seem to be with Gold currently. Scenario 1 - Gold completed its corrective and has bounced off the trend line shown in the previous post. This is the slow formation of the next rally with Gold about to complete Wave 1 of the next impulse. Since Gold had such a meteoric rise I don't think this outcome will stay valid but at the moment it still cannot be ruled out. Scenario 2 - Gold completed the first leg (Wave A) of its fall creating a low around 4402. This pullback is now Wave B which will take some time to play out before we have the final move down in the form of Wave C. This move would break the trend line shown. I am more inclined to think that this scenario will play out and I will personally be looking to trade this structure. I'm still not planning to try short gold anywhere - Just trying to wait for the pattern to complete and a good Risk to reward trade to emerge, one that we can trade with certainty. Let's wait and see how the price action develops. Charts below
🔥
16d •
Gold Finally Cracks
Date: 31/01 Its finally happened .. just when everyone thought the sky was the limit. Gold has fallen around 16% in a matter of days. Luckily we had already secured close to a 1:8 return on our positions, had booked profits and were trailing longs as we went along. It's been an awesome month so far. Now getting down to the important part - What next? The beauty of Elliot waves are that they show you all possibilities for the markets with confirmation points. All we need to do is be patient and wait till our confirmation points are triggered to know what scenario we are looking to play out. So before we jump in, one thing remains constant - Gold is still bullish overall. We just need to figure out if its finished its current up move on a large degree or a smaller one. I'll explain with the scenarios below. Scenario 1 - Scenario 1 on the daily chart shows us an impulse has completed. Now to further understand if scenario 1 holds true, this corrective needs to respect the 2-4 trend line drawn in red on the chart. If prices manage to sustain above and keep that trend line intact - we are heading back up to an all time high with the current impulse that completed being marked as W1 of 5. Judging by the speed with which this corrective has kicked in after a prolonged bullish period I'm unsure if this scenario will play out. I feel this is an ideal point for bigger players to book profits and for a slight cool off in Gold to take place as it prepares for its next surge. However, until the trend line holds - Scenario 1 is very much accurate and valid. Scenario 2 - Entry into this scenario kicks in the moment the 2-4 trend line breaks (as shown in the next daily chart). This break would indicate an end of a larger impulse and a deeper correction which is highlighted in the Weekly chart below. If this happens we are looking at a buy zone for Gold at around 4153 - 3700. I know it's a rather large zone but this would be a corrective on a much larger scale so the zone to buy will also be large. This however would be an ideal entry point to catch the next impulse once we see some positive price action in this area. Please do wait for a positive reversal from this area as Gold does have room below this to move downwards while still keeping this count completely valid.
🔥
21d •
Gold Update: Trail Your Longs
Date: 26/01 For those of you who have managed to ride the Gold wave with us our trade is already giving you a 6:1 return! I'm hoping all of you have booked substantial profits and are now closely trailing your longs as we enter a slight resistance zone for Gold. Our overall outlook and bullish view of course remains intact but this is a time to be cautious. Gold could pause / retrace from 5150 - 5200 levels. Any negative price action from close to these levels (we are already at 5110) should be considered as a warning sign and a possibility of a reversal. I recommend everyone to ensure that they've comfortably safe guarded their profits and are closely raising their trailing SL. Once a reversal does take place we will wait for the corrective to play out before we re-enter a new bullish Gold trade. Sharing images / path of gold below on 4H and daily chart Feel free to share your thoughts below
1-22 of 22
powered by

skool.com/investor-edge-club-9547
Clarity. Confidence. Wealth. Proven trading & investing foundations with Elliott Wave insights
Suggested communities
Powered by