Activity
Mon
Wed
Fri
Sun
Mar
Apr
May
Jun
Jul
Aug
Sep
Oct
Nov
Dec
Jan
Feb
What is this?
Less
More
Owned by Abhishek
Clarity. Confidence. Wealth. Proven trading & investing foundations with Elliott Wave insights
Memberships
Impulse Wave Trading
5 members • Free
The AI Hub
274 members • $50
Inbound Marketing & Novations
287 members • $9/month
Cash Communities
11 members • $27/month
the skool CLASSIFIEDS
1.3k members • Free
SD
Separated Dads Mindset Group
12 members • Free
Unfolding Community
80 members • Free
The Skool Hub
4.7k members • Free
Grow With Evelyn
2.5k members • $33/month
62 contributions to Investor Edge Club

🔥
4d •
What kind of account does everyone trade?
Thought I'd take a quick poll to see what kind of accounts everyone uses
Poll
4 members have voted
🔥
0 likes • 2d
@Ryan Williamson ah nice! How’s your experience been with the 2 prop firms? Any trouble with payouts or all smooth?

3d •
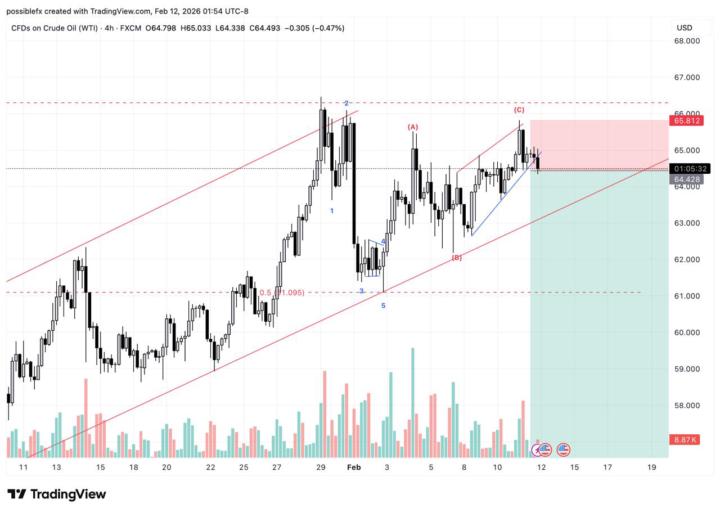
#USOIL
Oil completed a 5-wave impulse down followed by an ABC correction, with wave C printing a terminal ending diagonal. The break of the diagonal + impulsive wave 1/2 and now taking out wave 1 highs confirms a momentum shift. This looks like the beginning of a new impulsive sequence, not just a bounce. Watching for continuation and clean structure on lower timeframes. 🔥
🔥
1 like • 3d
Great catch on the terminal ending diagonal 👌🔥 .. Those moves can get tricky but if you catch them (like you have) they always yield great results. Amazing analysis
🔥
10d •
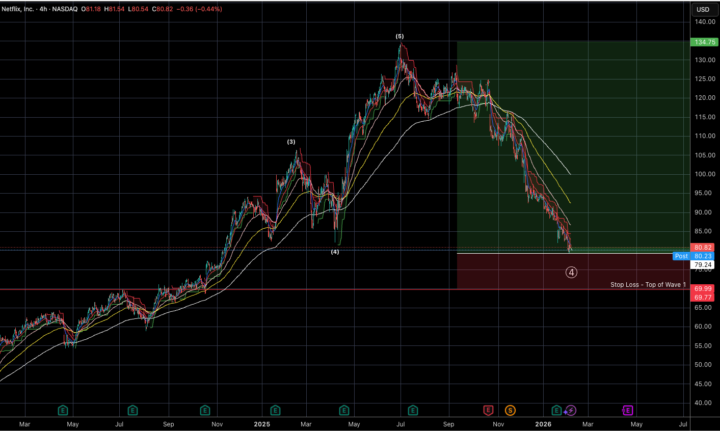
Stock Update: Netflix
Date: 06/02 As discussed in our previous post we were expecting Netflix to drift down from its highs of around 130 into the 82 - 80 range. Netflix is now playing at 80.87 and has presented us with a good risk to reward to enter for trading as well as investing purposes. The top of Wave 1 sits at 69.42 which will be our stop loss for all longs that we are entering at this level. For our count to remain valid Wave 4 cannot overlap with this point AT ALL. Entering here with a minimum target 133.8 gives us a solid 1:6 ratio and a crazy 66% gain on the upside making it a perfect trade as well as investment entry. Do keep in mind though that our stop loss of 69.42 must be followed strictly for all longs as below this we will have to re - analyse our wave count as the correction could get deeper pretty quickly. Charts shared below
🔥
0 likes • 9d
@Jason King feed in the stop loss level of 69 into ur system. After that, sit back and relax
🔥
1 like • 8d
@Brad Weyant Yep. This is a good zone to start layering buying orders. It’s giving you a solid risk to reward ratio.
🔥
0 likes • 9d
@Ryan Williamson 👌🏼
🔥
0 likes • 9d
@Jason King yes pls
🔥
Aug '25 •
👋 Welcome to Investor Edge Club – Start Here!
Hi everyone — I’m so glad you’re here! Investor Edge Club was built with one mission: to cut through the noise and give investors and traders a place to build wealth with clarity, confidence, and consistency. Here’s what you’ll find inside this community: - 📘 Free resources like the Insider Edge Toolkit to kickstart your journey. - 📊 Weekly insights on markets, sectors, and opportunities. - 📈 Elliott Wave and swing setups (explained in plain English). - 💬 A supportive place to ask questions, learn together and share charts, ideas and wins. - 📌 Monthly stock picks with huge long-term upside potential. - 📉 Methods and techniques to read charts and spot strong companies. - 💵 Money management strategies — from simple consistent investing to advanced plug-and-play approaches. 👉 Your first step: 1. Download the Toolkit (pinned above). 2. Introduce yourself below — share where you’re from and your #1 investing or trading goal for the year. 3. Explore the classroom content and join the conversation! Welcome aboard — let’s build smarter portfolios and sharper trades, together 🚀 Abhishek
🔥
1 like • 18d
@Duminda Gamage Welcome to the group! Glad to have you on board! Feel free to jump into different conversations happening here in the community. We're here all focused in on understanding how and why prices move in a particular fashion in various instruments. Whats your experience with trading or investing been like so far?
🔥
1 like • 10d
@Mubarik Iddrisu hey mate! Welcome to the group! Feel free to join into the conversations and leave photos of your charts or counts 🚀🔥
1-10 of 62

🔥
@abhishek-kapadia-5169
Elliott Wave analyst helping investors & traders read market structure, manage risk, and make better decisions across stocks, ETFs, FX & crypto.
Active 9h ago
Joined Aug 20, 2025