
Pinned

👑
⭐
9h •
Ai before ChatGPT: The Interview.
In this interview I sit down with Matt from NLP Logix. He's been working in the AI space longer than most people have been working in general. We dive into what changed and what is it going to be important about the future. This is a three part series, I will be posting another two videos from another two experts in mathematics and Engineering! Please like and comment on YouTube if you have time as well!
Pinned
👑
⭐
5d •
Welcome to Clief Notes. Here's where to start.
1. Go check out 📚Navigating The Course to see how to get around and what's here. 2. Start with The Foundation. Concepts, folder architecture, prompting framework. Everything else builds on this. 3. Check in at the bottom of each lesson. Polls, discussion posts, other members working through the same stuff. Use them. 4. When you're ready to build real things join in on our Biweekly competitions and win some real cash. ⭐ Competitions Mega Thread 5. If you are wanting to dive into the masterminds, grab all the past templates, artifacts and resources. Upgrade and head into the The Vault for Premium and The Drawing Room (VIP) for VIP 6. Post your work. Ask questions. Help others when you can. What are you here to build?
Pinned
👑
⭐
2d •
📣 New: one onboarding session, every week
I want to meet new members earlier, not months after you join. Right now a lot of people join the paid tiers and figure things out on their own. That's slower for you and it means I don't get to know you until you've already won a competition or posted in the Vault a few times. Further our Afternoon and High Tea calls 🫖 High Tea 9: The Graph the first bit of each call has been ALOT of intros and I think that eats away valuable time (not that getting to know you is not valuable) that members who have been around for a while look forward to during our live sessions. So starting this week, every new VIP and Premium member gets a standing invite to a short session with me and the mods. Calendar · Clief Notes 🕑 Wednesdays, 2pm 🎯 Open to new VIP and Premium members We'll cover: 🔑 Getting into Discord 🧭 Finding your way around 🤝 Getting the most out of other members 🏆 How to win the competitions ❓ Quick questions at the end (and feedback on what you really want out of value and such, helps me decicde if I need to add or change anything in the community) 30 minutes. One goal: you walk out knowing the community and I know your name.

2m •
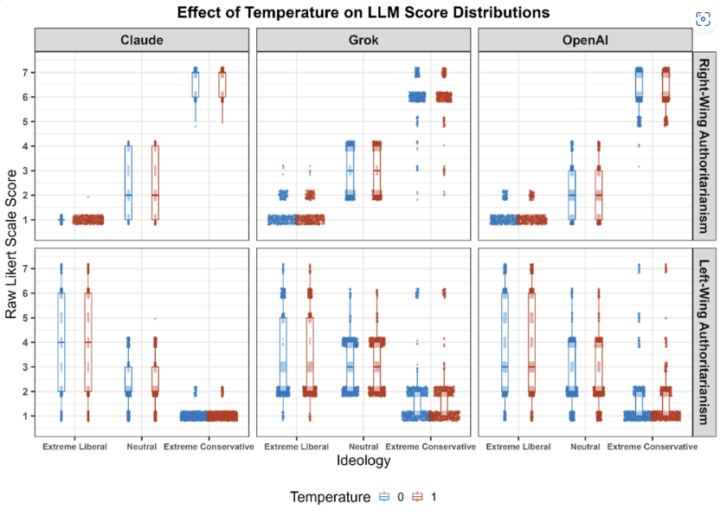
On Psychometric Temperature
@Jake Van Clief Regarding your github for evaluating LLMs on psychometric analysis tests: I'm looking at your attached graph and I have to say that the Variance of the results between a temperature of 1 and a temperature of 2 seem so minute, I'm left wondering what that variable is actually meant to represent, one. And, two: its effect is definitely well within the range of 1 standard deviation, so much so we might have plot a new section on a VAR graph to describe it... we'll call it: (σ ^0), that's 0 standard deviations for anyone that doesn't speak math. (If you found this funny, you're a genius and I salute you). But seriously Jake, I'd like to know what this Temperature variable is actually doing to the math and also did you try setting it to 3, or 4, or 5. What does that produce? Also to trust the results you need at least 180 occurrences to have enough data for the law of large numbers to apply; I know for sure I've tested it in real life many times. If that's difficult to compute, you can get by with 150, which will give you a 5% margin of error, which is too much for my liking, but in my experience anything less is just not reliable. So, serious questions here about the data set if you were looking to make it airtight. Not that the test is wrong, you just have to maybe run it more times, as your repetitions per question is set to 20, but I'm not sure if that actually represents the number of occurrences in the data set. Does it? If not, how many times did you run it? Thoughts? *My post here is not ai, I studied financial math and statistics when I worked at TD and Schwab in Margin-Risk Management, plus I built the financial model at my last firm. Statistical mathematics is an area of particular interest to me. Also, not too many people to talk to about data sets... but I find them very fascinating. So I hope you aren't taking me the wrong way here and I appreciate everything you're doing.
0
0

2d •
What's one AI habit that's saved you the most time?
AI tools seem to evolve every week. It's easy to get caught up trying every new model, app, or feature that gets released. But I have found that the biggest improvements usually don't come from constantly switching tools they come from building simple habits and workflows that you use consistently. For example, it could be: - Using AI to organize your notes. - Creating reusable prompts. - Automating repetitive tasks. - Summarizing meetings or research. - Brainstorming ideas before starting a project. What's one AI habit, workflow, or prompt you use regularly that genuinely saves you time? Not necessarily the most advanced just something practical that has made your work a little easier. I think a thread of simple, proven ideas could end up being more valuable than another list of "must-try" AI tools.

1-30 of 2,312
skool.com/cliefnotes
What we give away free beats most paid courses. Build durable AI systems with a Marine vet and Edinburgh researcher. 40+ lessons, growing.
Leaderboard (30-day)
1

🔥
+1715
2

🔥
+1578
3

+1522
4

+873
5

+609
Powered by