Activity
Mon
Wed
Fri
Sun
Jan
Feb
Mar
Apr
May
Jun
Jul
Aug
Sep
Oct
Nov
What is this?
Less
More
Memberships
AI Automation Agency Hub
272.4k members • Free
Join Mihai to make money fast
1k members • Free
AI Money Lab
38k members • Free
Free AI OFM Course
2.5k members • Free
AI & Skool Hub
1.2k members • Free
AI Automation (A-Z)
116.3k members • Free
Kourse (Free)
114.7k members • Free
AI Automation Society
202.4k members • Free
Data Alchemy
38.1k members • Free
18 contributions to Data Alchemy

Oct 1 •
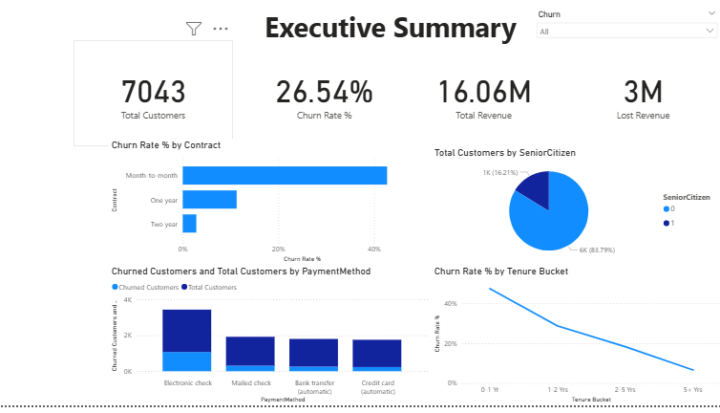
🚀 Power BI Project: Telco Customer Churn Analysis
🔹 Business Problem Telecom companies face high customer churn, leading to lost revenue and profitability challenges. This project focused on building a Power BI dashboard to uncover churn drivers and support data-driven retention strategies. 🔹 Key Metrics & Insights Total Customers, Churned Customers, Churn Rate % Revenue & Lost Revenue from churned customers Tenure Buckets to analyze customer loyalty patterns Customer breakdown by Contract Type, Payment Method, and Services used 🔹 Visual Storytelling KPI Cards for quick executive overview (Customers, Revenue, Churn %) Bar & Pie Charts to analyze churn by demographics and service usage Line Chart for churn trend across tenure buckets Treemap & Scatter Plot to identify churn drivers and high-risk customer groups 🔹 Narrative & Business Impact The dashboard revealed that month-to-month contracts and electronic check payments had the highest churn rates, while customers with longer tenure and tech support were more loyal. 👉 Business Actions: Introduce loyalty programs, optimize contract structures, and improve support services to reduce churn and protect revenue. 📊 Impact: Delivered clear visibility into churn drivers, enabling proactive decision-making, better customer retention, and improved profitability. #PowerBI #DataAnalytics #CustomerChurn #BusinessIntelligence #DataVisualization #DataDriven #Analytics #DashboardDesign #DataScience #CustomerRetention #TelcoAnalytics

1 like • 12d
Nice

Sep 23 •
ChatGPT - GPT-5
Hey everyone, I'm wondering if any developers here have used GPT-5 in their daily workflow? I've been using Cursor's agent for a while now with Claude Sonnet, and have been pretty satisfied with it (I'm going to be playing around with MCP soon to see how much more potential it can unlock). So for those who have used it, is it worth it? Do you see a sizeable improvement over Cursor?
1 like • 12d
I’ve tried GPT-5 in a few coding sessions, and the jump in clarity and problem understanding is noticeable. Worth testing if you rely heavily on AI during dev work.

Sep 18 •
Tried Building a Content Repurposing Automation
Lately I’ve been exploring ways to save time creating content, and I ended up building a little automation that takes one blog post and spins it into LinkedIn posts, tweets, IG captions, and even short-form scripts. The cool part is it also schedules everything automatically, so it feels like content is just “running in the background.” I recorded a breakdown of how I put it together here in case anyone wants to see the process. Not trying to promote anything — just thought this might be interesting for those of you experimenting with AI + automation. Curious if anyone here is building something similar?
1 like • 12d
This can automate money making

Mar 9 •
I am creating an external notion software for Time Tracking ⏱️
At this time I am creating an external software for notion, which can connect to the notion databases and allow to track the time and use some techniques such as Pomodoro and Flowmodoro My goal with this project is to solve 3 problems that notion currently has when trying to register time: 1 - Notion is not automatically updated, so you cannot see how time progresses in a minute to minute native timer 2 - Notion does not allow to place a sound that indicates when the time is over without using automations. 3 - You cannot place clear visual elements that indicate that time is running, so sometimes you could forget to stop the timer Let me know your opinion about this, do you think would be a useful product ? ⬇️
1 like • 12d
Great project

Sep 19 •
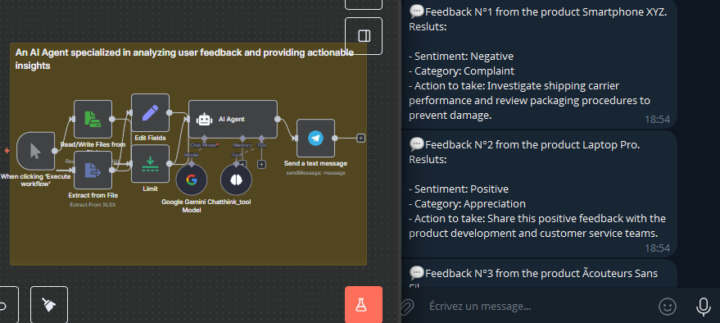
Build An AI Agent specialized in analyzing user feedback and providing actionable insights🎯
A little AI agent that reads customer feedback and understands it on its own! It can tell if it’s a complaint, a suggestion, or just a nice message and even suggests what to do next. Super handy to improve without reading everything manually 😊 We continue to learn 🔥 💻
1 like • 12d
This is exactly what teams need.
1-10 of 18

Active 13h ago
Joined Jul 31, 2025
Chennai
Powered by