Activity
Mon
Wed
Fri
Sun
Jan
Feb
Mar
Apr
May
Jun
Jul
Aug
Sep
Oct
Nov
What is this?
Less
More
Memberships
AndyNoCode
24.4k members • Free
AI Vibe Coders (Free)
4.8k members • Free
Plan Your Tech
75 members • Free
Kickstarter Challenge
23.5k members • Free
Real Men Real Style Community
13.8k members • Free
salesreps.com
301 members • Free
Kourse (Free)
114.7k members • Free
AI Automations by Kia
21.8k members • $1/month
Web Agency Accelerator (FREE)
13.5k members • Free
10 contributions to Data Alchemy

Oct 1 •
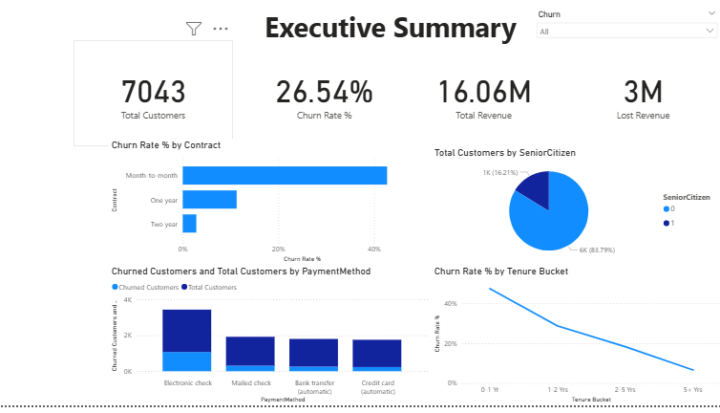
🚀 Power BI Project: Telco Customer Churn Analysis
🔹 Business Problem Telecom companies face high customer churn, leading to lost revenue and profitability challenges. This project focused on building a Power BI dashboard to uncover churn drivers and support data-driven retention strategies. 🔹 Key Metrics & Insights Total Customers, Churned Customers, Churn Rate % Revenue & Lost Revenue from churned customers Tenure Buckets to analyze customer loyalty patterns Customer breakdown by Contract Type, Payment Method, and Services used 🔹 Visual Storytelling KPI Cards for quick executive overview (Customers, Revenue, Churn %) Bar & Pie Charts to analyze churn by demographics and service usage Line Chart for churn trend across tenure buckets Treemap & Scatter Plot to identify churn drivers and high-risk customer groups 🔹 Narrative & Business Impact The dashboard revealed that month-to-month contracts and electronic check payments had the highest churn rates, while customers with longer tenure and tech support were more loyal. 👉 Business Actions: Introduce loyalty programs, optimize contract structures, and improve support services to reduce churn and protect revenue. 📊 Impact: Delivered clear visibility into churn drivers, enabling proactive decision-making, better customer retention, and improved profitability. #PowerBI #DataAnalytics #CustomerChurn #BusinessIntelligence #DataVisualization #DataDriven #Analytics #DashboardDesign #DataScience #CustomerRetention #TelcoAnalytics

Aug 31 •
Anyone else moving from BI to AI/Automations?
Hey folks, just wanted to check in. Is anyone here also making the jump from BI into AI/automations? I’m still pretty new to this space and figuring things out, so thought it’d be cool to connect with others on the same path. If you’ve got any tips or lessons from your own journey, would love to hear them!
1 like • Sep 1
Yes I am try but Problem is that Every AI tool Paid By the way I am Power Bi developer
1 like • Sep 6
@Aamir Syed N8n is free want to try Make leads etc etc with the help or Chat gpt
Sep 2 •
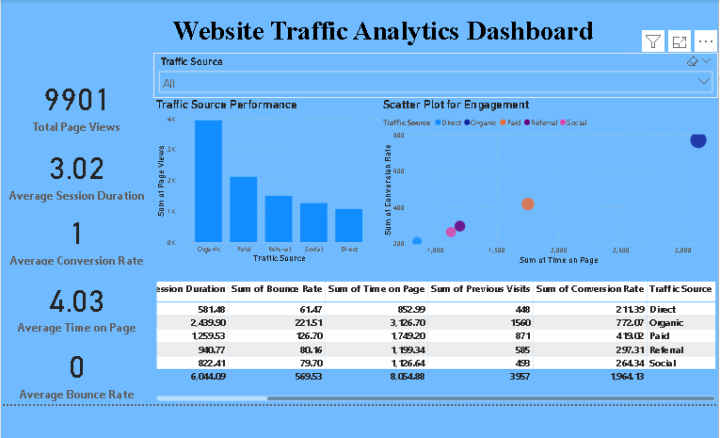
Website Traffic Analytics Dashboard | Power BI Project
Hi everyone, I’ve created a Power BI dashboard analyzing website traffic and user engagement. This dashboard helps visualize key metrics such as: - Page Views - Session Duration - Bounce Rate - Time on Page - Previous Visits - Conversion Rate It also includes interactive visuals like KPI cards, bar charts, scatter plots, and tables, which allow you to easily identify high-performing traffic sources and user behavior trends. You can use this dashboard to monitor website performance, analyze user engagement, and optimize conversions. I’m sharing it here for feedback and learning—feel free to check it out and share your thoughts!
1 like • Sep 2
@Brannon Winn Thanks for the advice! I understand — the real value is in tracking metrics that GA doesn’t provide. I’ll focus on finding KPIs that give deeper insights and add extra value
1 like • Sep 4
@Ana Crosatto Thomsen thank i will do that
Sep 1 •
Hi Data Alchemy
I’m Muhammad Affaf, a Data & Business Analytics Professional with 3+ years of experience turning complex data into clear, actionable insights. 📊 My Project Work Includes - HR Analytics → employee promotion prediction, workforce performance dashboards, and retention insights - Financial Analytics → tracking revenue, expenses, forecasting trends, and building executive dashboards - Operations & Logistics → warehouse network optimization, supply chain dashboards, and process automation - Sales & Marketing → product performance analysis, customer review sentiment, and KPI dashboards - Healthcare Analytics → patient profiling, health camp participation analysis, and KPI reporting ⚡ What I Do Best - Build interactive Power BI dashboards that leaders actually use - Automate reporting & data workflows (save hours every week) - Apply AI + analytics to uncover trends and support decision-making 🌍 Why I Joined This Community - To share real project case studies and automation use cases - To learn from others building in AI & automation - To connect with people who need data-driven solutions 📌 Connect with Me LinkedIn → linkedin.com/in/muhammadaffaf/ Fiverr → https://rb.gy/zlobkx Excited to collaborate, exchange ideas, and grow with you all 🚀
0 likes • Sep 3
@Rodrigo Zayas yes
Sep 3 •
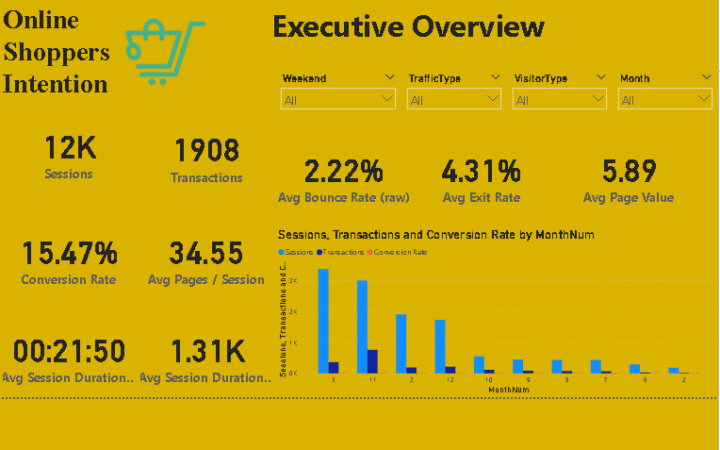
📊 Online Shoppers Purchasing Intention – Power BI Report
This Power BI report analyzes e-commerce user sessions to uncover patterns in purchasing behavior. The dashboard includes: - KPIs: Sessions, Transactions, Conversion Rate, Avg Pages/Session, Avg Duration - Engagement Metrics: Bounce Rate, Exit Rate, Page Value, Engagement Score - Trends & Insights: Monthly session & conversion trends, traffic source performance, visitor segmentation (new vs returning), weekend & holiday effects - Technology Analysis: Browser, OS, and region-wise engagement ✅ Built with data cleaning in Power Query, a star schema model, and custom DAX measures for conversion and engagement. ✅ Designed for interactive decision-making to help optimize marketing channels, user experience, and sales strategy.
1-10 of 10

@muhammad-affaf-9775
I am Business Analysis Complete my project and course looking for a work
Active 2d ago
Joined Aug 27, 2025
Karachi Pakistan
Powered by