Activity
Mon
Wed
Fri
Sun
Apr
May
Jun
Jul
Aug
Sep
Oct
Nov
Dec
Jan
Feb
Mar
What is this?
Less
More
Memberships
Investor Edge Club
14 members • Free
57 contributions to Investor Edge Club

3d •
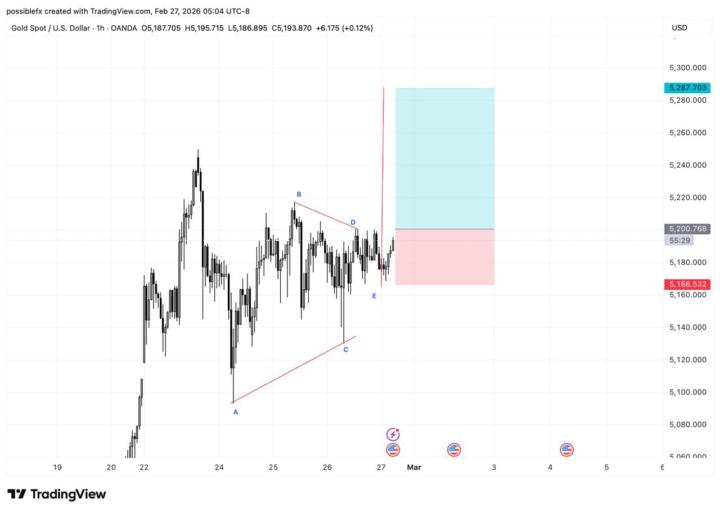
#XAUUSD
Gold (XAUUSD) — Impulse structure still respected 🔍 Wave 4 appears complete with a clean ABC correction into the 0.618 zone. Strong reaction confirms buyers defending structure. Now watching for continuation into wave 5 while risk remains clearly defined below the invalidation. Patience + structure = edge. 📈


1 like • 1d
@Abhishek Kapadia gold update path?
6d •
#XAUUSD
Patience pays. Structure broke → expansion followed. Waiting for confirmation instead of chasing noise. Risk defined, bias respected, execution clean. 📈 #Gold #XAUUSD #ElliottWave #TradingDiscipline #PriceAction #ImpulseWave #RiskManagement
1 like • 4d
[attachment]
1 like • 3d
Well done @Mubarik Iddrisu

🔥
3d •
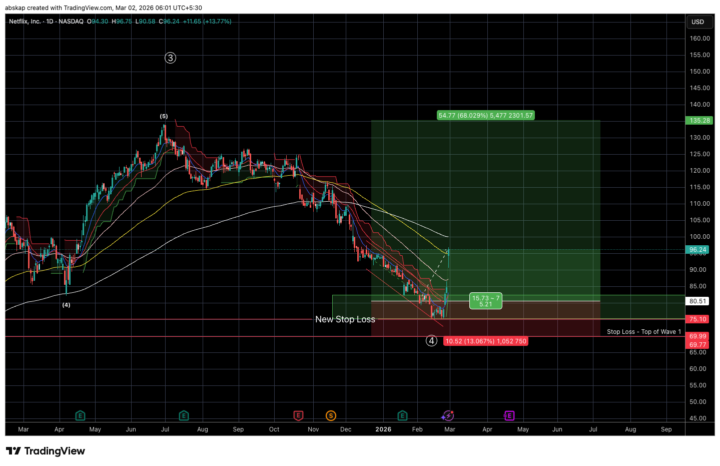
Stock Update II: Netflix
Date: 02/03/26 Just dropping a quick update on our Netflix stock pick. It seems that Netflix has bounced really well from our buy zone. Currently sitting at 96.24 (20% up from our buy zone) it seems like we've got this count spot on so far. The price is demonstrating all the behaviours of a 5th wave and is following all our Elliot rules as well. There was clearly no overlap with our stop loss of 69 (price moved from 75 levels) and the 5th wave that seems to have begun is moving fast and in gaps (currently in w3 of the 5th Wave). Let's see how this week plays out and lets keep an eye on if Netflix is coming back to fill the gaps it leaves on the charts or is gapping up and making green candles. That will give us an indication as to whether Netflix will rush to 130+ levels in a quick straight line or will grind out the journey slowly. For traders I always recommend trailing your longs and booking partial profits wherever you seem appropriate. A 20% move in such quick succession usually calls for some profit booking even though our targets of 130 are very much intact. For investors trading directly in the stock - our stop loss is now going to be pushed up to 75 (from 69). the 75 level now has absolutely no reason to be breached. We will keep raising our stop loss as the price rises as well. Charts attached below
2 likes • 3d
Amazing call on this one - holding it tight at the moment 🔥
🔥
11d •
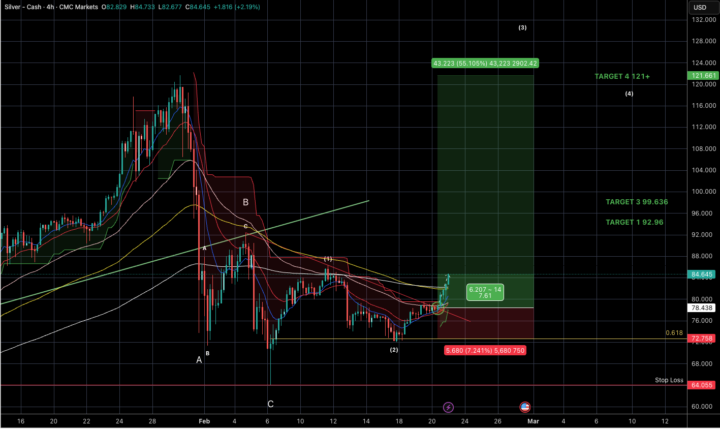
Silver - A Perfect Elliot Breakout
Date: 22/02 Even though most of our focus is usually on Gold here, the chart for Silver looked too good to ignore or share! The structure for Silver shows that an ABC has completed at a low of 64. This could indicate that silver has completed its Wave 4 and is ready to begin its rally with a new impulse starting Wave 5. The chart below shows a breakout from the corrective resistance and provides us with a clear invalidation, stop loss and set targets. If the correction in fact is not over and we are still in Wave 4 - Our targets still remain 92.96 and 99.636 which still provide 1:3 return from the breakout point. These are the minimum levels of retracement that will be needed in order for this to qualify as a retracement B Wave. We must be cautious and book profits at these levels as well as trail longs incase a sharp reversal does arrive. If the reversal is nowhere in sight and the structure continues to follow all impulse rules we are then looking at a target of 121+ in Silver which currently stands at a 1:7 return from the break point. Charts below
1 like • 4d
@Jason King Are you gonna book out on monday?
2 likes • 3d
96+++
🔥
8d •
🔍 One Question That Instantly Improves Elliott Wave Analysis
Before labeling any wave, pause and ask yourself this: “What would need to happen for this count to be invalid?” If you can answer that clearly: - Your bias softens - Your risk becomes defined - Your emotions calm down - If you can’t answer it: That’s usually the market telling you to wait, not force a count. 📌 One of the biggest Elliott Wave mistakes isn’t mislabeling —it’s labelling without invalidation. Inside this community, we treat invalidation as a feature, not a failure. 💬 Your turn:When you label a wave, do you usually define invalidation before or after thinking about targets? Reply with: - Before - After - Still learning how No judgement — this is how skill builds.

2 likes • 8d
Usually after 😅 but I do always follow what you mentioned above. If I don't know where the invalidation point is then i don't take the trade.
1-10 of 57

Active 1d ago
Joined Nov 29, 2025
Powered by