Activity
Mon
Wed
Fri
Sun
Aug
Sep
Oct
Nov
Dec
Jan
Feb
Mar
Apr
May
Jun
Jul
What is this?
Less
More
Memberships
AI Automation (A-Z)
163.2k members • Free
AIpreneurs
10.5k members • Free
Imperium Academy™
67.5k members • Free
AI Automation Agency Hub
328k members • Free
Appointment Setting Clan
6.6k members • Free
The AI Atelier
1.5k members • Free
Elite Architects AI
1.3k members • $80/month
AI SAAS Builders (Workshops)
5k members • Free
Accelerator University
10.1k members • Free
400 contributions to AI SAAS Builders (Workshops)

Mar '25 •
🎉 Exciting news, everyone - Final Stages of Live Window and Chrome Extension Development! 🎉
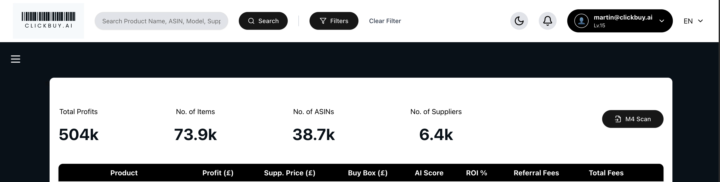
We're in the final stretch of development for our brand-new live window! 🚀 I've popped some screenshots below to give you a sneak peek! 👀 As you can see, we're focusing on a clean, intuitive design to make your workflow smoother than ever. 📷 First Image: User Interface Header The first image shows you the header of the new user interface. You can see that when you log in it now starts to build a user profile for yourself, which is the first stage of our orchestration function that we're trying to implement. You can also see that you can convert from light to dark mode to try and make the screen maybe more presentable. As well as, you'll notice that the additional add columns function has now been removed and what you've got instead is a set of predefined variables like profits, supply price, buy box price, return on investment which will give you a rough indication of whether it's a reasonable deal and then you'll move on to the next stage. 📷 Second Image: Live Data Window Activation The second screenshot is then the activation of the live data window. You'll notice on the right-hand side on the profitable line where you can see the most profitable product there a little down arrow. Clicking on the down arrow activates the live data window. Unlike before where you had a window which floated across the front of the screen, this is now fully integrated into the platform. At this point here, you can see that we are bringing in all of the metric points possible that you may use on a third-party Chrome extension but integrating them directly inside the platform and also having them interacting with our platform's data points, particularly around sourcing, for you to find either the best supplier or alternative suppliers if the primary one potentially is out of stock. You can see from the screenshots there inside the tabs, you've got basic product information on the top left. In the middle, you've got other sellers who are selling the product, what categories they are, whether it's Amazon, FBA, FBM, how much stock they're holding and obviously what their buy box prices are. On the right-hand side, you've got an analysis of the alerts of things like gating private label variations etc that you can review and assess. Then down bottom left-hand corner you got data associated to the sales rank and the buy box analysis and whether Amazon is on the listing. In the middle, you got buy box share which you can review over multiple date points and on the right-hand side the bottom right corner you've got the graphs showing you the buy box the sales drops etc associated to it of which you can scroll across at any point and it would show you the the dynamism within that process.
Mar '25 •
🚀 Calling All UK Shopify Sellers & Experts! 🇬🇧✨
Hey Shopify Community! 👋 We’re building an exciting new UK-based marketplace — designed to help Amazon, eBay, and Shopify sellers expand their reach and boost sales. 🎯 ✅ For Sellers: Got products? Let’s get them listed — for FREE — using our AI-powered platform that seamlessly integrates with Shopify via API. We’ll handle the heavy lifting of getting your products online and visible. 💪 ✅ For Shopify Experts: We’re also on the lookout for talented Shopify pros who want to collaborate and add value — from helping sellers onboard to shaping affiliate programs where you earn commissions on sales you help generate. 💸 💡 What’s in it for you? - Get your products onto a new UK marketplace (free setup!) - Reach more customers without extra marketing costs - Explore affiliate opportunities to earn commission - Be part of an evolving, seller-first community 🔥 👉 Interested? Let’s chat! Whether you’re a seller or a Shopify expert with ideas, I’d love to connect. Let’s build something big together. Martin 🚀


4 likes • Mar '25
That’s amazing
Mar '25 •
🤖 AI Revolution: AI Talking to AI! (Efficiency vs. Control?) 🤖
Mind-blowing! 🤯 Check out this video about Gibberlink, a new AI language that lets AI communicate 80% faster than humans! 🚀 Created by Boris Starov and Anton Piko at the 11 labs hackathon in London in February 2025 [00:25], Gibberlink uses sound waves to transmit data [00:32]. At ClickBuy, we're already working on AI-to-AI integration for sourcing and deal negotiation! 💪 The future is here, and it's intelligent! 💡 But... is this good for efficiency or bad for lack of control? 🤔 If AI talks in a language we don't know, are we as humans having to learn a new language to understand our AIs? 🤯 Where's the balance between speed and control? Let's discuss! 👇 Martin 🚀
Mar '25 •
🚀 Microsoft's Quantum Breakthrough: The Future Is NOW! 🌟
For the past 19 years, Microsoft has been on a relentless quest to unlock the power of quantum computing—and now, they’ve done it. But here’s the mind-blowing part: they haven’t invented a new material… they’ve DISCOVERED one. 🔬 A New State of Matter: The Birth of Topper Conductors Since childhood, we’ve been taught that everything exists in one of three states—solid, liquid, or gas. But Microsoft has just shattered that fundamental truth. There is now a FOURTH state of matter. 🤯 Enter Topper Conductors—a newly discovered material that defies classical physics. Unlike traditional materials, Topper Conductors can exist in multiple states at the same time. 🌀 What Makes This Revolutionary? These Topper Conductors have now been integrated into a quantum chip, allowing it to morph into different shapes and formats simultaneously. This is the key to unlocking quantum superposition—where instead of processing one calculation at a time, a quantum computer explores all possible outcomes at once. 💡 Think of it like this:A normal computer is like a detective solving a mystery step by step—checking clues, eliminating options, and eventually finding the answer. 🕵️♂️ A quantum computer? It sees every possible answer instantly—as if it could read the entire book of reality in one glance. 📖⚡ What Happens in the Next 3-5 Years? Now, imagine this: In no more than five years, you could have one of these quantum chips in your phone. 📱 Yes, you read that right. A single chip in your phone could be as powerful—if not MORE powerful—than every single cloud server and supercomputer on Earth COMBINED. 🌍💾 This isn’t just an upgrade in technology—it’s a complete paradigm shift in computational power and reasoning. What Will This Unlock? 🔹 Instant AI & Automation 🤖 – No more waiting for algorithms to train. AI models will be created in real time. 🔹 Unimaginable Scientific Discoveries 🔬 – Simulations that once took decades will be completed in minutes. 🔹 Limitless Creativity & Invention 🎨 – “Design me a spaceship that travels at 100x the speed of light and tell me how to build it.” Done.

1-10 of 400

@martin-mcdonagh-1458
Founder @ ProcessZero 🤖 | Helping UK SMEs automate repetitive tasks and grow their businesses with intelligent AI agents
Active 88d ago
Joined Oct 9, 2024
United Kingdom