Activity
Mon
Wed
Fri
Sun
Jul
Aug
Sep
Oct
Nov
Dec
Jan
Feb
Mar
Apr
May
Jun
What is this?
Less
More
Memberships
AI Automation Society
404.1k members • Free
Ship 30 for 30
4.6k members • Free
Full Stack Writer
2.8k members • Free
Category Newsletter Creator
1.7k members • Free
LinkedIn AI
1k members • Free
PGA (Course Only)
2.2k members • Free
11 contributions to Multilingual Mastery

Mar '25 •
Fab Friday
So after last week being a bit shiz mostly on the health front today is Fabulous Friday 💜 Being included in @Nic Mooney Female Fabulous Founders and included in a Forbes feature (total surprise) As my nan says luck 🍀 good or bad happens in 3’s I might buy a lotto ticket (does it even still happen 🤷🏼♀️ ) https://www.forbes.com/sites/jodiecook/2025/03/27/if-youre-on-the-verge-of-quitting-read-these-7-inspirational-stories/

1 like • Mar '25
Amazing story, @Rachael Lemon. Good on you 😊

Mar '25 •
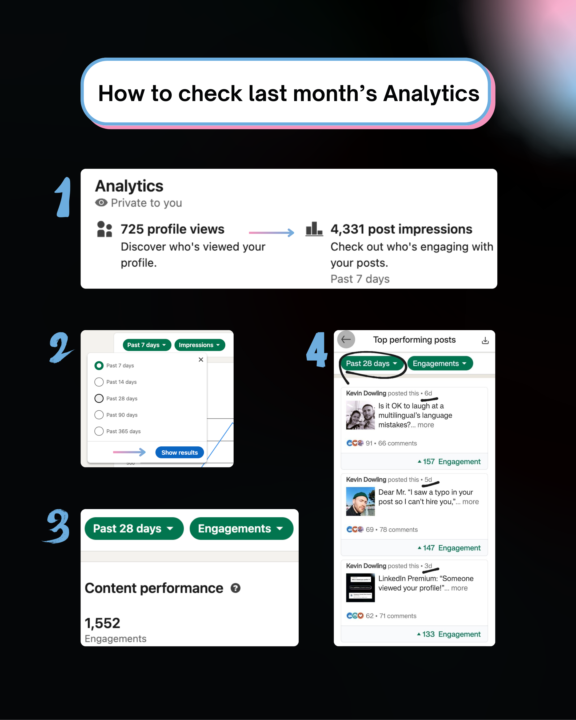
Checking Your Analytics 📊 (Content Strategy)
Hey guys, Remember how we had the Storytelling workshop a few weeks back? And I said how I'd be leaning more into stories. Last week, I told only stories (through my usual problems/perspective/proof way). This week, I wrote only story emails... Results: my engagement DOUBLED in my content, plus I got 5x more replies in emails this week... For LinkedIn, my last's week's post outperformed the whole previous 28 days, and even a lot of February. I'll be posting about it today, but I just created a quick 'how-to' since it's end-of-month now and the perfect time for you to be reflecting! This is how you can check your Analytics (left image). I recommend doing it and seeing which posts performed well (look at engagements > impressions). When you switch to 28 days, this is how it shows up (I did it on mobile on the right, but you can see how all my highest-engagement posts came from last week. The golden thread = stories 📖 I even got tagged in a post today because of my 'Someone viewed your profile' story-post and it inspired someone to create a new post from it. Pretty cool... Anyways, worth spending 20-30 minutes end of month to see how you can create more engaging content for your audience in April ✌️ ~Kev P.S. Any questions on content strategy/analytics, let me know! I geek out on this stuff from time to time hehe.
4 likes • Mar '25
Great results, doesn't surprise me one bit. Funnily enough, one of my personal story posts, which had nothing to do with the work I do or ICP, led to someone DMing me for a chat. It didn't lead to any work (wasn't a prio for me), but it goes to show you don't need to over hack your content.
Mar '25 •
Testing How To Build A Lead-List
Hey all, After our call yesterday I got thinking about quicker ways you can build that weekly list from your current connections. And one thing came to mind I haven't done in a LONG time. You can go to LinkedIn Settings > Privacy and export your data. I've done this in the past to access specific things but if you click 'Download larger data archive' it gives you everything (connections etc.) I'm waiting for mine to be done but then my plan is to: 1. Download the ZIP and extract the Connections CVS file 2. Upload the CSV to GPT (just drag it in or send file) 2. Ask my AI minion to help my sort by: • What filters I want (e.g. job titles like “coach,” “consultant,” “creator,” “solopreneur,” etc.) • Any exclusions (e.g. agencies, recruiters) • Which offer each type of lead might be better for (entry/mid offer) Then I'll use this to: • Create a prioritised outreach list (50–100 leads) • Segment them by offer fit (I have 2 offers in circulation) • Have custom DM openers + follow-up messages for each segment I'll report back on progress, but just in case anyone else is looking for a way to get some AI-assisted help with whose currently in your network and you're not using Sales Navigator. This could be useful ✌️ ~Kev P.S. Once I do it, I'll put up a training of the process. Here's a quick walkthrough of the first part!
1 like • Mar '25
You're a wizard, Kevin!
Feb '25 •
February MasterMind 🔮
Hey everyone, Reminder that tomorrow's call is our monthly MasterMind. Last month, we looked at 1 specific challenge you were facing and how you could take actions to move past that for the month ahead. This time, we'll follow a similar format. Only I want to quickly summarise and review the previous month, based on your action step. ✅ What worked well in the terms of actions you took ❌ What held you back and kept you stuck If you've solved that problem, wonderful. Think of a new challenge that has come up and we can work on that together. You can also share it in the comments below, and what you need most help with. Remember, these sessions are to give you the support and advice you need, in any of the 3 key areas that help you build your business: - mindset - strategy - skills If you can't make it tomorrow, let me know below. Based on numbers, I will make sure we all have adequate time for each person in the hot seat to get the help you need 🤝 See you then, Kev
4 likes • Feb '25
Hey @Kevin Dowling, I'll join today but not sure I'll have much to contribute... Get well soon @Riddhi Chaudhari
2 likes • Feb '25
Published my 1x post of the week. It feels GOOD to rant 😁
Feb '25 •
Canva Magic Stories
Thought this would be useful for the Canva Pro subscribers after the mini demo Kev just gave us on Gamma. I will test it out over the next few days and report back https://www.canva.com/en_gb/help/using-magic-presentations/ PS not sure if this is the right channel for this but couldn't find a better option.
2 likes • Feb '25
cc @Rachel Williams @Kay Donaghy @Riddhi Chaudhari @Kevin Dowling
1-10 of 11

Active 16h ago
Joined Apr 15, 2026
Paphos, Cyprus