Activity
Mon
Wed
Fri
Sun
Nov
Dec
Jan
Feb
Mar
Apr
May
Jun
Jul
Aug
Sep
Oct
What is this?
Less
More
Allistar Center
193
Free
32 contributions to Allistar Center

28d •
I analysed 3,382 crop formations statistically — here's the full report
I've had an archive of crop formation diagrams sitting around for a while — 31 annual collections covering 1990 to 2020, 3,382 formations in total. I finally ran a proper analysis on it and I'm sharing everything. How it was done I wrote down every hypothesis and its pass/fail threshold before running any test, so I couldn't move the goalposts once I saw results. Every test is logged — 148 of them — including the ones that found nothing. Each positive claim had to beat a null model built to mimic ordinary design choices. What didn't hold up - No golden ratio. φ appears in 6% of formations where chance predicts 8.2% — it's less common than random. - No Fibonacci in element counts. - None of 16 tested constants (√2, √3, π, harmonic ratios) came out above chance. - No match to 4D polytope projections — tesseract, 600-cell, none of them. - Not language-like: no Zipf's law, and the apparent "grammar" turned out to be just "small shapes sit inside big shapes". What did hold up - Complexity roughly tripled across 30 years, with a clear break around 1999. It survives every control I could throw at it. - Six-fold symmetry went from 2.5% of formations in the 90s to 10% after 2010. - Elements are laid out in a consistent order from the centre outwards — reading outward, the next element is far more predictable than chance. The honest caveat, stated at the top of the report: these are measurements of diagrams drawn by an illustrator, not of the fields themselves. So this is evidence about the drawings. That cuts both ways though — a person drawing with digital tools would tidy proportions toward clean ratios, not away from them. Their absence is therefore meaningful. Report, code, raw test log and the pre-registration are all public: https://xxxallistarxxx-one.github.io/crop-formation-analysis/ I also documented three mistakes I made in my own control models and how I caught them — that's in there too, rather than quietly fixed.


3 likes • 28d
This is good. Lots of interesting tangents from it. A few more classes for a complete taxonomy: - projections from higher dimensions - topological analysis - graph networks
Sep 5 •
Missed you all for a bit — here's what's new.
Been heads-down in the lab for weeks instead of posting — long overdue for an update. Here's part of what's happened since I went quiet, more to come. Claude helped me calibrate and connect one of my VNAs to the PC software and run some tests. The cones showed an amazing S11 (Return Loss) at a resonant frequency of 2.85 MHz. Later, when using a Slayer circuit with a MOSFET, the LED got brighter at that same frequency — which independently confirmed the measurement. S11 tells you how much power sent into the antenna is actually absorbed versus reflected back to the source. You can see the numbers in the first image, and in the second image you can get a sense of what a value like -61 dB actually means in practice. The third image shows the Sierpinski gasket Merkabah. You can see multiple spikes with good S11, but they sit well above what a standard oscilloscope or signal generator can handle — most of that gear only works up to 80–90 MHz, so it's essentially blind above that range. I also need to rule out contamination from the leads sticking up off the coax cable, since they can act as a dipole antenna themselves and might be contributing to some of those spikes. Next, you can see I'm building crystal holders where I wind copper wire and arrange them symmetrically around the cone's equator, pulsing them that way. This isn't the final design yet. Working in Fusion 360 hasn't been easy for me, but I just discovered something amazing — using an MCP connection, I can actually talk to Claude Code, and it executes the parametric modeling for me, examines what I've already built, and suggests better designs and ideas. This could take things to a whole new level and finally help us build the structural elements for the big Space-Time Antenna — the parts that need to hold real weight and hold tight tolerances. The last few days I also learned something important about diodes. The ones I've been using aren't good above about 30 kHz. A diode doesn't switch off instantly when voltage reverses — it keeps conducting backward for a short window first. On the scope, that showed up as roughly 450 nanoseconds of "leakage" every cycle. At low frequency that's nothing, but at 1 MHz each full cycle is only 1000 nanoseconds long, so that dead zone eats up nearly half of it. And yet we were still getting some power transfer above 800 kHz despite that.

1 like • Sep 5
This makes sense. Using Revit with Claude and sadly didn't realize that you encountered the problem with the diodes, that feedback could have saved you some time but I missed the opportunity. Best of luck, call out if I can be of any assistance.

2 likes • Aug 16
Interesting question, I don’t think so. My intuition says personal problems escalated, I think he’s been derailed and he was receiving some negative influence at least 5 weeks ago 😔
May 25 •
🙏 From the bottom of my heart — thank you.
Yesterday you showed up. And what unfolded became one of the most genuine and powerful sessions we have ever had together. I want you to know that I do not take that lightly. Your presence, your openness, your willingness to go deep — that is what made it what it was. I am truly grateful for each one of you. --- 🎙️ Now — the honest truth about the recording. I recorded the session with Camtasia, but made a technical mistake on my first Google Meet: I only captured internal audio and forgot to toggle my USB mic, so my voice is almost entirely missing from the recording. Of all sessions to lose — it had to be this one. 😄 But what happened next became its own lesson. I caught myself reacting — and chose to assign a positive meaning to it. Which, if you were there, you'll recognise as a live demonstration of exactly what we were discussing. The framework works. Even on me. 🙏 The content is too valuable to let go. So I want to know what serves YOU most: 🔵 Option A — We recreate the live session, properly recorded, and go even deeper 🟡 Option B — I create a dedicated video on how sound affects the brain and what makes this such a powerful permission slip 🟢 Option C — Both: video first, then a live deep-dive Drop your vote below 👇 Your answer shapes what we do next.
Poll
14 members have voted
2 likes • May 25
And I get to test your sound files (have a bit of prior experience in the field) and provide feedback if you want
May 19 •
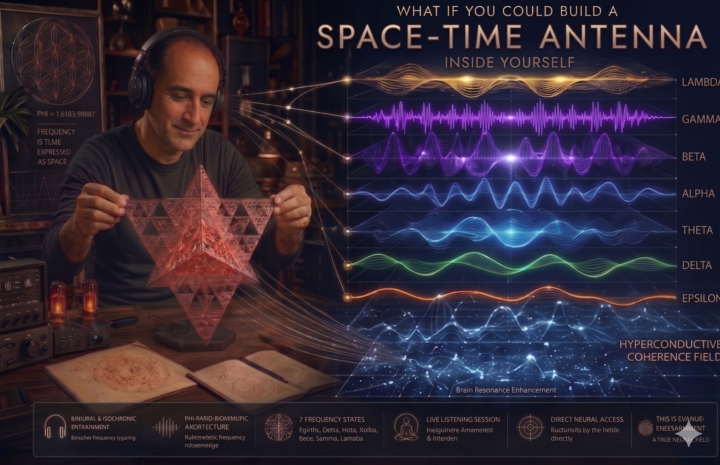
📡 What if you could build a Space-Time Antenna inside yourself?
Bashar has spoken about the Space-Time Antenna — that simply seeing it, rotating it in your imagination, is enough to heighten perception and open access to higher-dimensional frequencies. I've been building one physically with copper and sacred geometry. And something unexpected happened. The physical antenna works by translating space into time — we take different dimensions of space (height, width, depth) and place them in golden ratio relationship. The copper structure then expresses time through resonant fields and cyclic frequencies. Space becomes time. Then I discovered the reverse is also true. We can take time into space — take frequency relationships, hertz values, cycle timing — and express them dimensionally as pressure waves moving through air. Sound. A spatial architecture made entirely of time relationships. A Time-Space Antenna. This means the antenna doesn't have to be copper. It can be sound. And sound can be received directly by us. The brain operates across seven frequency bandwidths simultaneously — five well-established, two (Epsilon and Lambda) at the frontier of neuroscience. The Space-Time Antenna is built from seven squares, seven octaves. The Flash Matrix encodes seven Fibonacci sequences. Seven is not a coincidence. Light itself carries seven colors — merging into pure white when unified. The seven chakras map the same spectrum through the body. Seven appears to be the natural resonant structure of consciousness itself — written into physics, biology, and perception simultaneously. What we've created are sounds built from phi-ratio geometry — sweep frequencies that carry the same architecture as the physical antenna. Listenable. Receivable. You don't need copper. You need the pattern. And here is the big why. The brain does not generate solutions — it receives them. The higher mind conceives. The brain receives, and the mind perceives, refracts, and reflects the information back. When the mind tries to do the higher mind's job — figuring out, controlling, solving — it burns out. It was never designed for that task. Only the higher self knows how. This is why so many people experience ADHD, mental exhaustion, and endless looping — the mind is scanning for answers it fundamentally cannot produce. A well-tuned brain doesn't think harder. It receives more clearly.
2 likes • May 19
Multiple sources (Bashar, Ra, Hermes Trismegistus, yogis, the Manual etc) talk about the internal transformation/ crystallisation. This is it, you’re knocking at this door and we’re here to help open for everyone. Looking forward to it.
1-10 of 32