Activity
Mon
Wed
Fri
Sun
Jun
Jul
Aug
Sep
Oct
Nov
Dec
Jan
Feb
Mar
Apr
What is this?
Less
More
Memberships
Corporate Surprises (free)
685 members • Free
IEESG - Comunidad Geselliana
56 members • Free
Abundance Engineering
118 members • Free
BeyondTheBottomLine
73 members • Free
Financial Analysis in Business
334 members • Free
Parallel Income Club
55 members • Free
EVERESTXV
40 members • Free
EJ
Education, Jobs & Money
2.3k members • Free
Studicata
17.9k members • Free
19 contributions to The Energy Data Scientist

Mar 25 •
How to learn Coding in the era of AI
I am sharing a summary from an HR/Careers conference in Applied Software Engineering. People are complaining of forgetting the code they learnt at uni, or on online courses. They learnt it, and now it's' gone. So the fastest way to learn coding today is not to sit through dozens of online courses on Udemy, Coursera, or edX and hope the knowledge sticks. If you have tried that route, ask yourself honestly: how much of it do you remember three months later? Most of it is gone. That approach feels productive in the moment only. Instead, the smartest path is to start with Python and study code that already exists inside industry case studies. You see exactly how it is applied in real-world cases. Then Open GitHub, and upload a full project. First, actually work with the code e.g. maybe you need to combine the code of 5-10 courses together . Change the data slightly,. Then upload your version to GitHub with a clean, nicely written README file and well-presented code (comments etc). Do not panic about volume. You only need to upload 1 machine learning project and 1 optimisation project over the course of 8 -12 months. Takes time if you are absolute beginner. That is enough to make you extremely attractive to employers : internships and junior jobs. This is better than MSc degrees because they are filled with exams and homework , whose solutions circulate around and you copy-paste and employers know it. Every time you upload a project, write a LinkedIn post about it if you aren't shy . So, take ten or twenty courses from the Classroom, as many as you need, and combine what you learn from them into a single coherent project or more. If you are ambitious, try to publish your work as a paper. Even better. Shows prestige. Nobody does these simple things and everyone goes to do MSc , which is fine ofcourse if you have the money. That is the whole strategy. HR managers almost never see this level of discipline from candidates. Most CVs simply list "I completed 5 courses on Udemy" or "I finished 10 courses on edX," but they never remember what they did there. They have the certificate but in the interview they say they forgot.
2 likes • Mar 25
I have some extra resources from the conference - I will share it soon.

Mar 24 •
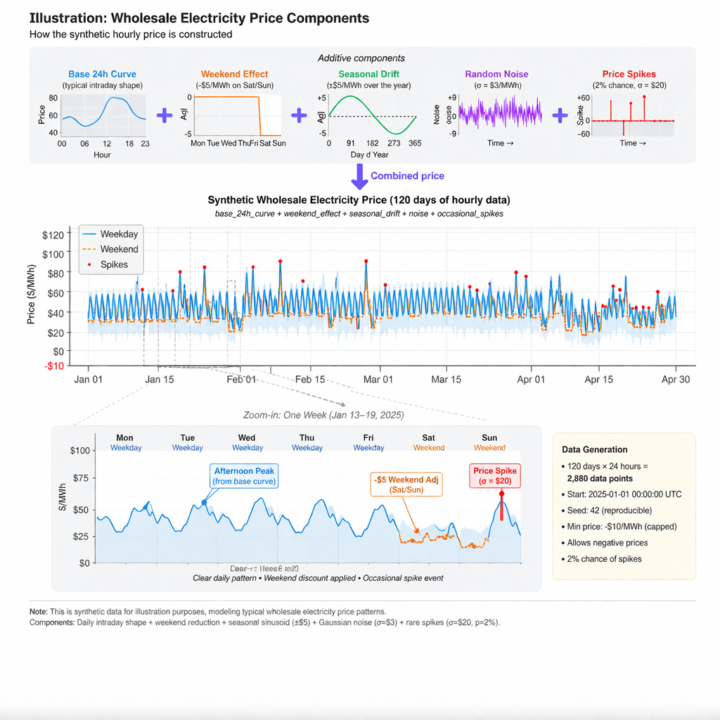
Wholesale Electricity Price and Energy Storage Trading
The attached slide shows how the wholesale electricity price is structured. As a reminder, electricity markets have two parts: wholesale and retail. Energy Storage trades in wholesale. In the modelling of the wholesale electricity price we need to consider that there is a daily pattern where prices rise and fall during the day, a weekend effect where prices drop slightly over the weekend, a slow seasonal drift over the year, small random noise, and occasional large spikes. So all these together make the wholesale electricity price. This kind of modelling for the wholesale electricity price is a key part of energy storage analysis because revenue depends heavily on price patterns. I am currently creating a new course which is in progress, where we use machine learning for energy storage trading. I was part of a consulting project focused on the profitability of energy storage, and this type of price modelling is exactly what we use in practice. The course will show step by step why we model prices this way, what each component means, and how to implement it in Python. You can use the code directly and adapt it to your own work or consulting projects. This is also very useful for interviews since questions about energy storage and wholesale prices are very common. For example, you might be asked what drift is or how seasonal effects are modeled, and this course helps you clearly explain the why, what, and how. It will be ready soon. In the meantime, this attached slide illustrates the components of the wholesale electricity price.
1 like • Mar 25
Great idea. Looking forward to. Because ML is used very much in energy so if we can focus more on this !
Mar 16 •
New Online Course: Kernel Density Estimation
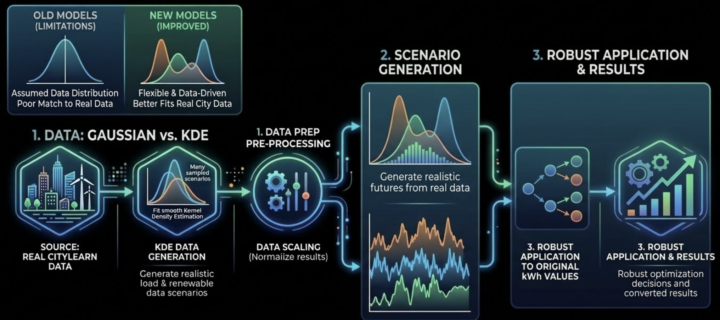
A new online course has been published in Classroom. It is course 118. Its title is "Kernel Density Estimation". Kernel Density Estimation (KDE) is a highly effective statistical method used in the energy sector. It allows you to take an existing dataset and generate new, realistic values that follow the exact same underlying patterns. This is perfect for when you need to simulate multiple scenarios. Specifically, in this course: - we look at a smart building with uncertain electricity demand, using 8760 hourly values (one year of data). - we want to simulate 1000 unique days where the demand is different but strictly follows the "logic" of our original dataset. - we walk through generating KDE-based data and using it to solve Monte Carlo and two-stage stochastic optimization models. These methods are absolute standards in the energy sector. Best of all, this is a highly applied course. I show you exactly how I used these exact techniques in a real-world energy project, so you can move past academic textbook exercises and start applying this to actual problems. The attached screenshots show the step-by-step process of how KDE is applied in industry. And also the differences between using KDE and non-KDE approaches ; KDE is more realistic. Non-KDE approaches are easier to model but lack realism.
0 likes • Mar 19
@Gary Young that’s where the idea gets really powerful. In power markets, for example, KDE can preserve the fat tails and price spikes caused by outages, weather shocks, or congestion, but pairing it with grid and dispatch models helps explain why those spikes emerge and how stress propagates through the system. In finance, the same logic applies: KDE can generate realistic distributions for spreads, defaults, or liquidity conditions, while network or balance-sheet models reveal the leverage, funding dependencies, and counterparty links driving those outcomes.

Mar 19 •
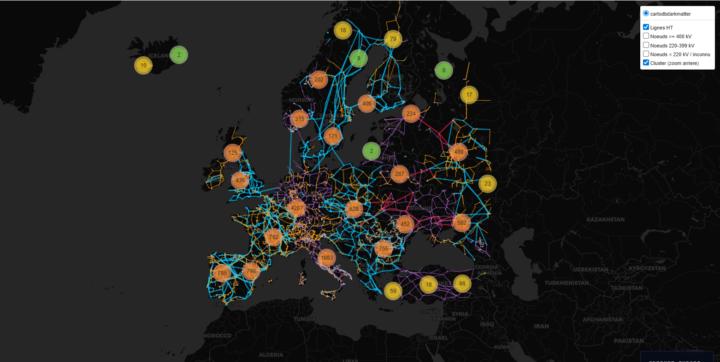
⚡ Networks grids & Storage — Part 1/...
🗺️ Where it started To better understand energy networks and their geographic topology, I dove into open source data — specifically OpenStreetMap and GridKit — to map transmission nodes and lines across Europe and the UK. There are already plenty of courses on grids and storage. So instead of passively consuming content... I decided to build something. 🎯 Project Goals Technical side: - Sharpen my Python + mapping skills (Folium / GeoPandas) - Experiment with Vibe Coding (rapid iteration, AI-assisted prototyping) Knowledge side: - Understand the role of energy storage and load balancing in modern grids - Identify the critical materials and minerals behind storage technologies (lithium, cobalt, vanadium, manganese...) - Map out the key players in the sector — utilities, pure-play storage companies, and emerging startups 💡 Open questions — your ideas welcome! Some threads I'm already pulling on: - Where are the bottlenecks in European transmission networks? - How is the storage mix evolving — short-term (batteries) vs. long-term (hydrogen, pumped hydro)? - What business models are emerging around grid flexibility? What would you add to this project? 👇 Series in progress — more in the next post 🔄
1 like • Mar 19
Really strong project. So, building your own map . Love it . The attached image is well striking and already communicates the scale of the network well ok ? But: it would be even stronger with a clearer legend or a couple of annotations so readers can immediately understand what the colors,, and node counts represent. Ok ? So, strong maps work best when they make the intended message easy to grasp at a glance. I’d also suggest narrowing each post to one main theme like bottlenecks, storage technologies, or business models. So the series feels more focused and each visual supports a single takeaway. Another improvement would be adding one early insight or surprise from the data, because that turns the post from “here’s what I built” into “here’s what I’m already learning.” But overall very good from my perspective .

Mar 18 •
Challenges about career path
I am currently struggling a bit with my future career path. Because job opportunities in the energy sector are limited in my country, I am trying to identify alternative routes. However, I do not want to stop working on energy markets and the sector itself. For me, it seems somewhat easier to enter the finance industry. Which department within finance would best support this long-term goal? I have been thinking that starting in a treasury department might be helpful, since it is directly related to monetary conditions and financial management. What do you think about this? If there is no direct path into energy markets, how should I build an alternative route that would still move me toward that objective?
0 likes • Mar 19
Mustafa so many people have same as you ideas and thoughts . According to academic process 3 steps are needed: The first step is to decide clearly what kind of role you want inside the wider energy sector. For example, do you want to move toward energy markets, trading, market analysis, regulation, strategy, project finance, or commercial roles? Once you choose the direction, everything else becomes easier, because you can align your CV, LinkedIn, applications, and learning around one clear story. Employers usually respond better when they can immediately understand your professional focus. The second step is to build a profile that shows consistency. Your CV and LinkedIn should make it very clear that your long-term interest is energy, and that you are developing relevant business and economic skills to become stronger in that sector. This is important because you do not want to look undecided. You want to look like someone who understands the industry and is becoming more valuable within it. The third step , Mustafa , is to add finance and economics in a selective way. You do not need to become a pure finance professional. Instead, focus on the parts that are directly useful for energy, such as pricing, risk, valuation, investment analysis, market design, and the economic logic behind projects and trading decisions. That way, your profile becomes broader without losing direction.
1-10 of 19
Active 10d ago
Joined Dec 1, 2025
ESTP
Belgium