Activity
Mon
Wed
Fri
Sun
Feb
Mar
Apr
May
Jun
Jul
Aug
Sep
Oct
Nov
Dec
What is this?
Less
More
Memberships
Builder’s Console Log 🛠️
1.6k members • Free
Learn Microsoft Fabric
14.5k members • Free
22 contributions to Learn Microsoft Fabric
Fabric Unified Admin Monitoring
Hey everyone, there is another (unofficial) Microsoft project just released which unifies a lot of Fabric Monitoring datasets into one Lakehouse, and a report. It's called FUAM - Fabric Unified Admin Monitoring. You can watch a demo here: https://www.youtube.com/watch?v=CmHMOsQcMGI You can check out the GitHub repo here: https://github.com/microsoft/fabric-toolbox/tree/main/monitoring/fabric-unified-admin-monitoring FUAM extracts the following data from the tenant: - Tenant Settings - Delegated Tenant Settings - Activities - Workspaces - Capacities - Capacity Metrics - Tenant meta data (Scanner API) - Capacity Refreshables - Git Connections - Engine level insights (coming soon in optimization module) What do you think? Something you might find helpful in your organization?
Lakehouse source control
Hey everyone, Since MS states that "Only the Lakehouse container artifact is tracked in git in the current experience. Tables (Delta and non-Delta) and Folders in the Files section aren't tracked and versioned in git", is there any other option to source control the lakehouse objects, such as tables, shortcuts, default semantic model views, etc? Lakehouse deployment pipelines and git integration - Microsoft Fabric | Microsoft Learn One option I can think of is to extract the object definitions into a notebook and source control the notebook, but not sure if that's a good idea. Another option is to use a warehouse instead of lakehouse.
0 likes • Apr 7
@Will Needham thanks for confirming Will! I'm leaning towards notebook approach but need to test how to script out all the objects into a notebook, since we would like to build a standardized lakehouse definition that can be deployed across the board and have the code checked into git.
Fabric Roadmap - in Power BI format
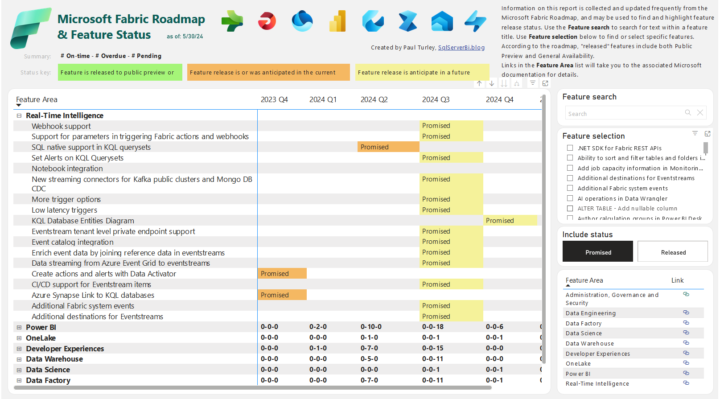
I've always thought the Microsoft Release Plan (aka Roadmap) documentation page is pretty difficult to navigate, and always had in the back of mind the idea to create a more user-friendly version. Well, turns out I wasn't the only one, and now Paul Turley has created a Power BI report to visualise what is coming on the roadmap! You can see it here: 👉🔗 Link to Paul's blog post explaining the report 👉🔗 Link to the report itself What do you think? A much nicer user experience IMO!

1 like • Jan 31
@Will Needham I had a look, but unfortunately this feature falls short of expectations. Currently the only items are logged/available - Data engineering (GraphQL) - Eventhouse monitoring in Real-Time Intelligence - Mirrored database - Power BI I'm interested in being able to query the fabric monitor data, which includes things like pipeline runs, notebook runs, etc. and being able to see which pipeline/notebook runs failed in order to build alerts on top of it. I submitted a feature request or something like that a few months back, hopefully the ability to query the fabric monitor data will come one day. Right now we try to run most of our scheduled tasks using Fabric pipelines and setting schedules on those pipelines, perhaps we may need to switch back to ADF + log analytics for better monitoring and alerting capabilities
Exciting Governance features revealed (First Look, not released yet)
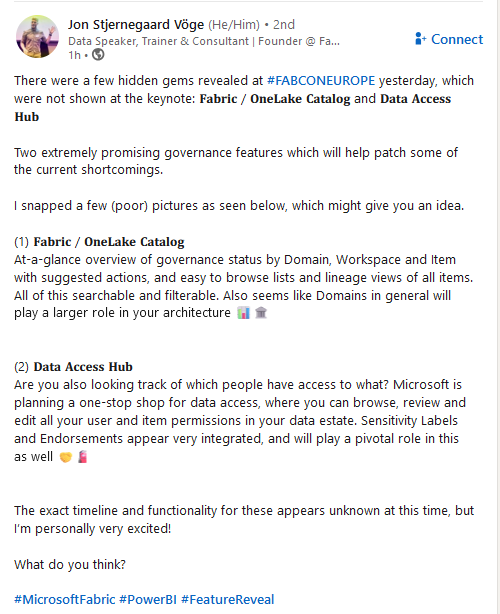
Just saw this post on LinkedIn from Jon Stjernegaard Vöge on some new Governance features which are currently being developed - I'm glad Microsoft are taking this direction - looks very promising. Jon's post: "There were a few hidden gems revealed at hashtag#FABCONEUROPE yesterday, which were not shown at the keynote: 𝐅𝐚𝐛𝐫𝐢𝐜 / 𝐎𝐧𝐞𝐋𝐚𝐤𝐞 𝐂𝐚𝐭𝐚𝐥𝐨𝐠 and 𝐃𝐚𝐭𝐚 𝐀𝐜𝐜𝐞𝐬𝐬 𝐇𝐮𝐛 Two extremely promising governance features which will help patch some of the current shortcomings.I snapped a few (poor) pictures as seen below, which might give you an idea. 1) 𝐅𝐚𝐛𝐫𝐢𝐜 / 𝐎𝐧𝐞𝐋𝐚𝐤𝐞 𝐂𝐚𝐭𝐚𝐥𝐨𝐠 At-a-glance overview of governance status by Domain, Workspace and Item with suggested actions, and easy to browse lists and lineage views of all items. All of this searchable and filterable. Also seems like Domains in general will play a larger role in your architecture 2) 𝐃𝐚𝐭𝐚 𝐀𝐜𝐜𝐞𝐬𝐬 𝐇𝐮𝐛 Are you also looking track of which people have access to what? Microsoft is planning a one-stop shop for data access, where you can browse, review and edit all your user and item permissions in your data estate. Sensitivity Labels and Endorsements appear very integrated, and will play a pivotal role in this as well 🤝🧯The exact timeline and functionality for these appears unknown at this time, but I’m personally very excited! What do you think?"

Need help with measure performance on direct lake model
Hi Everyone, I have created the following measure on a semantic model using direct lake, which looks something like this Measure = SWITCH( TRUE(), SELECTEDVALUE(Transactions[ClassID]) IN {1234, 5678}, SUM(Transactions[Quantity]), DISTINCTCOUNT(Transactions[TransactionID]) ) The measure works perfectly fine in a PowerBI card visual, but when I try to use the same measure in a table/matrix, any resulting query would basically time out I've tried the following but nothing seems to work - Use IF instead of SWITCH, made no difference and query still times out - Tried other aggregate functions instead of DISTINCTCOUNT, such as both conditions using SUM, and also made no difference and query still times out - I even tried both conditions doing SUM(Transactions[Quantity]) and it still doesn't work. Measure = SUM(Transactions[Quantity]) works perfectly fine, of course. Without showing the entire DAX query, when I traced the query in PowerBI desktop for a simple matrix, snippets of the query looks like the below, which eventually times out VAR __DS0Core = SUMMARIZECOLUMNS( ROLLUPADDISSUBTOTAL( ROLLUPGROUP( 'Transactions'[TransactionDisplayName], 'CampaignCategory'[CampaignCategoryName], 'Item'[ItemName], 'Class'[ClassName] ), "IsGrandTotalRowTotal" ), __DS0FilterTable, __DS0FilterTable2, __DS0FilterTable3, "SumQuantity", CALCULATE(SUM('silver_Transaction'[Quantity])), "Measure", 'Transactions'[Measure] ) I'm not good at DAX, so if anyone can shed some insight on how to rewrite this measure to perform in a table/matrix that would be highly appreciated. Thanks in advance.
0 likes • Sep '24
I did some more tests today with additional observations, unfortunately these observations do not result in a solution to the DAX query performance issue - The same measure performs poorly in both Direct Lake mode as well as Import mode, so it doesn't appear direct lake is solely to blame for this problem - Performed additional testing with displaying the measure in a table. Basically, the DAX query still runs quickly when the query only uses the Transaction fact table, but once I introduce joins to dimension tables then performance suffers significantly. The DAX query still returns if I join to 1 or 2 smaller dimension tables, but once I start joining to larger dimension tables (e.g. the Transaction fact table has ~300k rows while the large dimension table has ~20k rows) then performance degrades quickly. Basically, when the DAX query joins the transaction fact table to 1 large dimension table and another (smaller) dimension table, then the query times out. For now I'll resort to calculating and storing the output of the measure within the transaction fact table in the lakehouse (since calculated columns are not supported in direct lake IIRC), but if anyone knows how to optimize the DAX measure it would be much appreciated.
1-10 of 22
@brian-szeto-2173
I'm a data architect with extensive data warehousing experience, primarily focused on financial industry.
Active 36d ago
Joined Feb 26, 2024
Powered by


