
Write something
Pinned

Feb 2 •
📌 Start Here — Read This First
Welcome to Strata Market Structure Lab. This community exists for one reason: to help futures traders understand why price reacts where it does. Not signals. Not trade calls. Not hype. ✅ What this community is Inside here, I’ll share: - Annotated chart breakdowns (NinjaTrader) - Examples of failed breakouts, traps, and reactions - Explanations of market structure and price behavior - Weekly “why it reacted here” style posts Everything is focused on context and structure — how the market is actually moving under the surface. ✅ What this community is not You will not find: - Buy/sell signals - Entries or exits - Indicator downloads - Settings or scripts - “Just follow this trade” content That’s intentional. The goal here is to help you see the market more clearly, not to copy trades. ✅ About the indicators The charts and explanations shared here are derived from the same framework used in my indicators: - StrataLevels - Level-Force - Flux-Levels - VWAP Percentage Levels - Candle Countdown Flag Those tools are sold and supported on my website, not inside this community. 👉 https://StrataLevels.com This space is where I explain the why.The indicators are the how, plotted live in real time. ✅ How to use this community If you’re new: 1. Browse the chart breakdowns 2. Study the structure examples 3. Read the weekly reaction posts If you’re already a customer: - Feel free to ask questions - Chime in on structure discussions - Help keep this place grounded and practical No hype. No pressure.Just clean structure and real charts. Glad you’re here. Strata-Levels Team
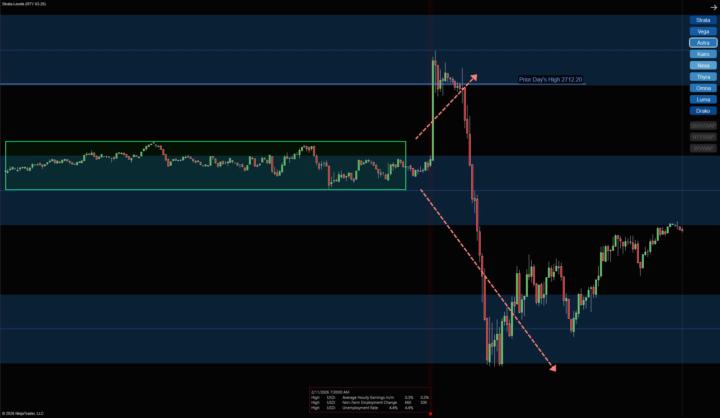
Feb 14 •
RTY & ES – Compression → Break → Failure
This week had some of those sessions where nothing happens… until everything does. Most of the days were tight. Overlapping candles. No real directional commitment. Just compression building. Then we finally got the expansion. RTY & ES broke higher out of the tight range and pushed fast. Looked strong. Clean breakout. Momentum showed up. But here’s the part that mattered: Price ran directly into a higher Strata Level that has reacted before… and stalled immediately. No acceptance above it. Instead, we got rejection. From those failure points above, the move to the downside was roughly a $3,000 contract swing on either instrument with minimal risk. That was the real opportunity. What stood out: • Clear early compression • Strong breakout attempt • Immediate stall at a key level • Clean rotation back to lower structure Reminder: Breakouts alone are not the edge. Where they run into is. If you traded it, how did you approach it? Break and go? Wait for failure? Or sit out the chop early? Curious what you saw.
1
0
Feb 10 •
🟡 Gold Futures — Weekly Structure Check
Gold gave us a choppy, narrow-range session today. Not a trend day. Not a clean expansion day. One of those environments where forcing trades usually does more damage than good. This is where context matters more than execution. On the chart, price spent most of the session rotating around weekly VWAP, with Strata Levels framing the range cleanly above and below. No follow-through. No acceptance away from structure. Just repeated tests and failures. That combination tells a simple story: - Weekly VWAP = fair value - Strata Levels = boundaries of balance - Inside that range = noise When price can’t build acceptance away from VWAP and structure holds, patience is the trade. Days like this are a good reminder that the framework isn’t just about finding entries — it’s about knowing when conditions don’t favor them. If you stayed selective today or played the range, that is the win. We’ll see what happens when price either: - Accepts away from weekly VWAP, or - Breaks cleanly through structure with follow-through Until then, it’s just rotation.
1
0
Feb 2 •
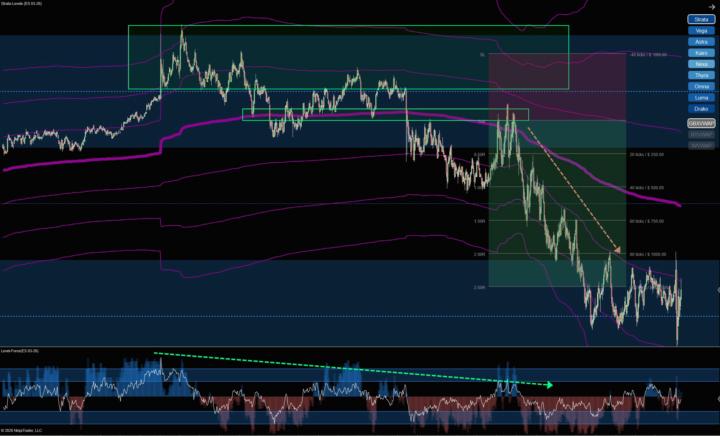
Why Price Stalled Here
Price didn’t stall here randomly. This area lined up with a predefined structural zone inside a higher-timeframe balance. As price approached it, momentum slowed, follow-through weakened, and rotation started to show up almost immediately. What’s important here isn’t the exact level — it’s the context. When price pushes into structure without expansion behind it, stalling is often the first sign that the move is running out of energy. This is a common behavior in day trading, especially when traders are chasing a move late and ignoring where price is relative to structure. Zones like this are mapped ahead of time in the Strata framework and plotted live in the StrataLevels tool. The value isn’t predicting the move — it’s knowing where reactions are likely before price gets there. No signals. Just structure and context.
Feb 2 •
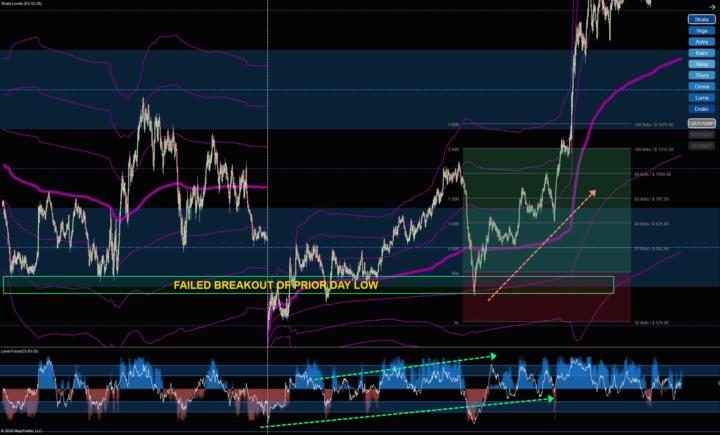
Why This Breakout Failed
At first glance, this looked like a clean break of the prior day’s low. Price pushed below the level, momentum picked up briefly, and it looked like continuation was underway. But structurally, this was a low-quality breakout. The prior day’s low was sitting inside a broader area of balance, not at the edge of expansion. When price broke below it without strong follow-through, sellers quickly ran out of fuel. As selling pressure stalled, late shorts were forced to cover and price rotated back into range. This is a common day trading trap, especially around prior session levels. A break alone isn’t enough — context matters. Without expansion away from structure, breaks often fail. This type of behavior is visible ahead of time when structure is mapped and understood. The goal isn’t to predict the move, but to recognize when a breakout is vulnerable. No signals. Just structure and context.
1-6 of 6
powered by
skool.com/strata-market-structure-lab-4771
A futures day trading community focused on market structure, price levels, and why moves happen – not signals or trade calls.
Suggested communities
Powered by