

Feb 25 •
The Highest-Probability Way to Trade NVDA Earnings Tonight?
NVDA reports after the bell tonight, and this is the single most important event of the week for the entire technology complex, for AI capex sentiment, and potentially for sector rotation across the market! If NVDA re-prices the AI narrative, QQQ moves, growth vs value rotation shifts, even energy and cyclicals feel it through flows. Now here’s what’s interesting. Consensus is extreme: 65-66B revenue, +66% YoY. EPS up 70%, Data Center nearly the whole engine. The base case is already beat and strong guide. You'd expect options to price this like a bomb, but they aren't! The at-the-money straddle implies roughly a 5-6% move. Over the last 12 quarters, the average implied move was closer to 7.5%. By NVDA's own standards, this event is being priced smaller than usual. That's the first non-obvious signal. The second one is even more important. Historically, NVDA's implied earnings move trades at about 1.5x the tech sector (XLK). This quarter, that ratio is closer to 0.9x. Read that again: the market is pricing NVDA as less idiosyncratic than the sector, at a moment when AI capex concentration arguably makes it more idiosyncratic than ever. Yes, front-week IV is high (72% vs 55% baseline). Yes, there will likely be IV crush. But the lazy trade "short the rich IV" assumes the event premium itself is bloated. This time, the event premium is compressed relative to history and relative to tech. That changes the game, so we're not putting on calendar spreads today. The edge, in my view, sits in: - NVDA vs sector variance - Defined-risk or asymmetric volatility harvesting The market is not overpricing fear, it's compressing NVDA's uniqueness into sector volatility, and if that assumption breaks tonight, the move won't care about your straddle math. Because the event move is priced relatively small (5-6%) and the front-week premium is not unusually fat versus history, forcing a weekly Jade Lizard would mean selling compressed event variance with thin margin for error. So instead of playing the binary print, we step out to April (51 DTE) and build a safer Earnings Jade Lizard.
1
0
Feb 10 •
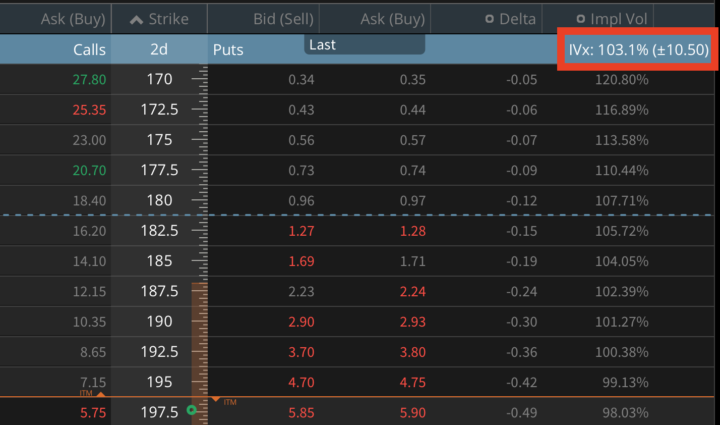
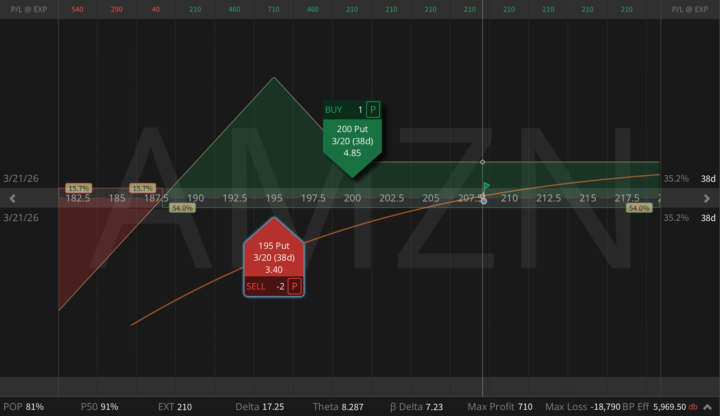
Amazon After Earnings: When Ratio Risk Beats Naked Risk
Last week we skipped trading AMZN earnings. Options were pricing 7.5%, reality was -14%, so short gamma was not the place to be. In my personal view it was only a repricing of capex and FCF timing, nothing more. AWS re-accelerated, ads keep growing >20%, NA retail margins are improving, but the market suddenly realized buybacks and FCF are pushed out by heavy AI capex. Post-earnings, the setup changed. The shock is out, downside skew is still rich, and fundamental downside convexity is much lower than before the print. That's why ratio risk now beats naked risk, so today I'm expressing this via a March put ratio:
2
0
Jan 22 •
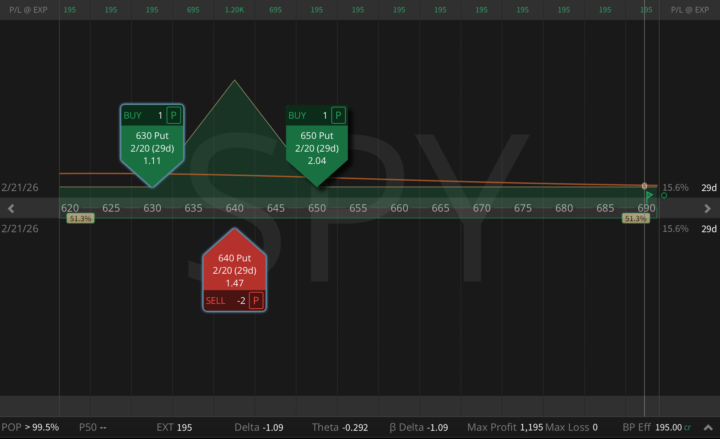
Converting a SPY Put Ratio Into a Risk-Free Butterfly 🦋 (Again)
Hey, on Tuesday I published a new trade idea: a SPY 650/640 put ratio spread (1x2), 31 DTE, opened for a $306 credit right as volatility spiked. The objective was simple: get paid for the panic. Today I've pulled a super-strategic move: just bought the 630 put for $1.11, and that single adjustment transformed the entire position into a risk-free butterfly 🦋 (!) with: - Zero downside risk - Zero upside risk - Max profit: $1,200 - Min profit: $195 - Probability of Profit (PoP): 100% This is what most traders miss in high-volatility regimes: you're not predicting direction; you're engineering a distribution. When fear is overpriced, you can sometimes lock structures where the market pays you first, then sells you the wing cheap enough to remove the tail. I do this setup on SPY all the time, but the framework works on any liquid ticker with tight markets: QQQ, IWM, and even selected single names.
1
0
Dec '25 •
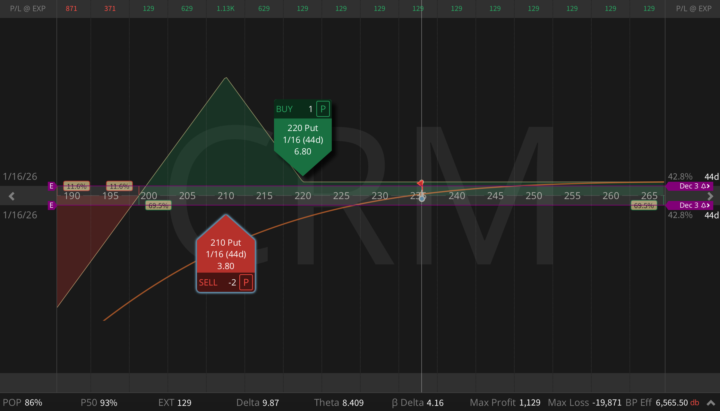
CRM Earnings Put Ratio Into Agentforce Test
CRM reports after the bell, and the setup is actually fascinating. The stock sits around $235, down 36% from highs and 30% YTD. Growth has slowed, but fundamentals aren't broken. They're just… less sexy. IV is pricing a 7-8% move, skew is modest, and this is exactly the type of environment where I want to be slightly long CRM and short rich downside vol, with a wide cushion if we get a controlled pullback. Let's see what Marc Benioff brings us tonight!
2
0
Nov '25 •
A Sector Spread With Teeth: XLV-XLE Pair Trade
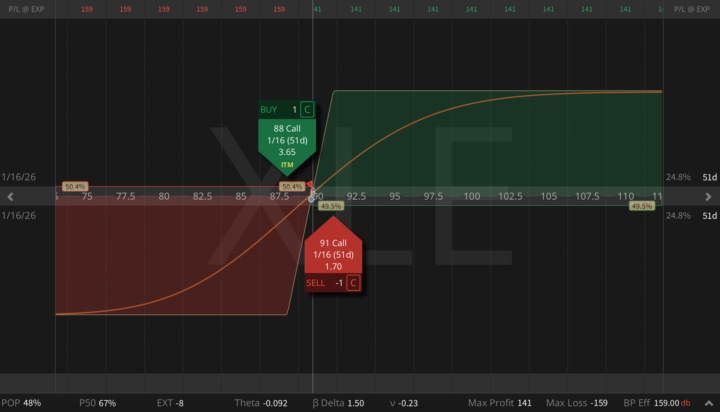
Hey, in the previous posts, I shared that rotation charts are finally giving us clean signals: XLV (Healthcare) keeps gaining relative strength, while XLE (Energy) is recovering after weeks of underperformance. Both sectors moved into a decision zone, and today I'm showing the exact structure I'm using to trade that divergence in the hedge fund. Part 1: XLE Call Debit Spread (Defined-Risk Snapback Play) - Buy 88C / Sell 91C Jan 16 (51 DTE), Debit: $1.59, Max Profit: $141 - A clean, defined-risk way to play the standard Energy bounce inside a choppy, low-volatility range. If XLE mean-reverts toward 90–92, this structure pays quickly Part 2: XLV Call Ratio Spread (Harvesting Exhaustion) - Buy 160C / Sell 2× 163C Jan 16 (51 DTE), Max Profit: $357, Max Risk is undefined (but extremely manageable in XLV). - XLV is extended, overbought, and showing early fatigue. Elevated IV makes upper-strike calls expensive, perfect for a ratio spread that benefits from slowing momentum or shallow consolidation. Why it works as a pairs trade? These aren't two isolated ideas, they're one combined expression: - XLE - defined-risk long delta where bounce probability is high - XLV - premium capture where trend exhaustion is visible - Combined - smooth Greeks, positive theta, and exposure to sector divergence rather than index direction. This is how you express rotation and sector behavior without guessing the market's next move. A clean, elegant pairs structure built for this macro regime.
2
0
1-7 of 7
powered by

skool.com/jcow-capital-6336
Define Risk - Manage Risk - Take Risk
Join for growth
- Strategic Updates
- Market Outlook
- Daily Reviews
Suggested communities
Powered by