

Jun 18 •
Hello Community! Glendel Fyne says hi! 🤗
Hello everybody! 👋 Mi name is Glendel Fyne, and I am very excited to join me to the "Luca Berton AI Cloud Lab" community. I am currently exploring how to build more reliable AI Agents for real-world contexts: roles, memory, permissions, governed execution, evidence, coordination, and clear boundaries between what the model reasons and what the system actually executes. I am very interested in learning from the community, sharing ideas, and comparing approaches with people who are building AI Agents in real-world scenarios. It is a pleasure to be here, and thanks again for welcoming me to this community! 🚀
0
0
Jun 4 •
Claude Code Masterclass — ship real, tested code with AI (full workflow)
How many AI coding tutorials have you watched — and how many real projects have you actually shipped? This course closes that gap. You'll internalize one loop that runs through everything you build — **Plan → Implement → Test → Review → Commit** — and use it to ship a real, tested feature end to end. Write prompts that read like well-scoped tickets, generate honest test suites, run Best-of-N to pick winners on evidence, and wire up professional git, MCP, hooks, and skills. You stay the engineer of record the whole time: Claude proposes, you decide what ships. What you'll learn: • Run the five-step loop on every change so AI bugs are caught before prod • Write spec-grade prompts and CLAUDE.md brain files • Pick the best solution with Best-of-N and rubric scoring • Generate honest tests and make Claude review its own code • Run safe git workflows and connect tools via the GitHub MCP server • Automate guardrails with hooks and skills, then score production readiness 🔴 Live cohort (5-hour intensive, limited seats): https://maven.com/luca-berton/claude-code-ai-coding-masterclass 🎓 Self-paced on Udemy: https://www.udemy.com/course/claude-code-masterclass/ 📘 Companion book on Leanpub: https://leanpub.com/claude-code Taught by Luca Berton — cloud architect, automation engineer, and bestselling author of *Ansible for VMware by Examples* and *Ansible for Kubernetes by Examples*. #ClaudeCode #AICoding #PromptEngineering #SoftwareEngineering #Anthropic
0
0
Jun 2 •
🚀 May 2026 Recap: AI Agents Are Becoming Real Infrastructure
May was a packed month on the blog — and one theme kept showing up everywhere: AI is moving from experiments into production systems. I covered a lot this month, including: 🤖 Agentic AI on AWS - AWS Summit Amsterdam 2026 focused heavily on Amazon Bedrock AgentCore, managed agents, enterprise data platforms, and how companies are starting to run AI agents safely at scale. 🧠 Claude Code and AI-assisted development. I announced the Claude Code Bootcamp and shared practical workflows for using CLAUDE.md files, test generation, screenshot-to-UI workflows, and production-ready AI coding patterns. ☁️ GPU platforms and enterprise AI. At Red Hat Summit 2026, I presented “GPUs Take Flight,” focused on multi-tenant GPU platform engineering with OpenShift AI, NVIDIA, quotas, guardrails, and cost control. 🔐 AI security and observability. A big topic this month was how to secure, monitor, and govern AI agents — especially when they interact with tools, files, email, APIs, and production environments. 🛠️ Practical cloud engineering. I also shared hands-on posts about AWS account cleanup, SQL Server performance tuning, Vercel cost optimization, Rust in 2026, and local/open LLM deployment. The big takeaway? AI agents are no longer just cool demos. They now need the same discipline we already apply to cloud infrastructure: identity, observability, security, cost control, and deployment automation. That’s where the real work begins. 👉 Full May recap here:https://lucaberton.com/blog/ What was the most interesting AI/cloud topic for you this month?
0
0
May 28 •
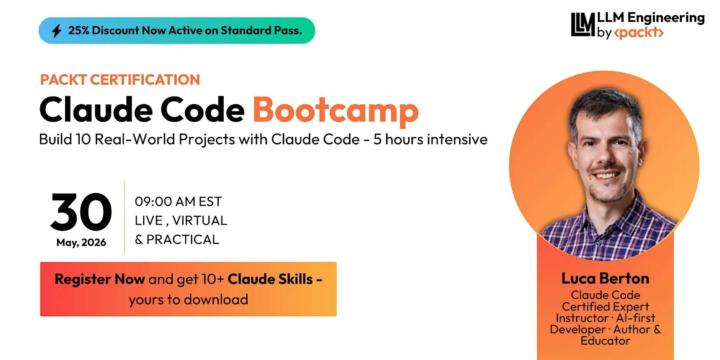
Build real projects with Claude Code — 40% discount for my community
Hi everyone, AI coding tools are everywhere right now. Some are useful.Some are noisy.Some make you question whether the machine is helping you… or just confidently inventing new bugs for your entertainment. But one tool I’ve been spending more and more time with is Claude Code. And that’s why I’m excited to share that I’m running the Claude Code Bootcamp Certification together with Packt. This is not a “watch 80 slides about the future of AI” kind of workshop. It’s a practical, hands-on bootcamp focused on using Claude Code to build real-world projects and improve the way you work as a developer, engineer, or technical professional. We’ll cover things like: - how to use Claude Code in real development workflows - how to build practical projects instead of just playing with prompts - how to create reusable Claude Skills - how to move faster without losing control of your codebase - how to apply AI-assisted development to everyday engineering tasks The goal is simple: Help you become more productive with AI coding tools in a way that is actually useful at work. Not magic.Not hype.Just practical workflows, real examples, and less time staring at your terminal wondering why everything is broken. Packt has also created an exclusive discount for my community: Use code: LUCA40 This gives you 40% off the workshop registration. You can register here: https://www.eventbrite.co.uk/e/claude-code-bootcamp-tickets-1988549372704?aff=luca If you’re curious about Claude Code, AI-assisted development, or how to make these tools part of your real workflow, I’d love to see you there. Bring your laptop, your curiosity, and your most dramatic debugging stories. See you in the bootcamp, Luca
0
0
May 17 •
NYC, coffee, and the future of AI
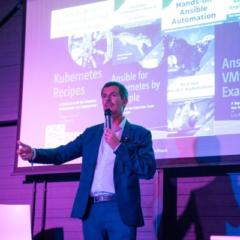
I’ve been spending time in New York recently, and one thing has become very clear: every meetup, event, and coffee chat eventually turns into a conversation about AI. Not just the hype. The real questions. How do we move from demos to production? How do enterprises build AI systems that are secure, scalable, and cost-efficient? How do we connect LLMs with real business data? How do we govern AI without slowing innovation? How do infrastructure, data platforms, and automation evolve in this new cycle? For me, the most interesting part of AI is not the model alone. It is the full system around it: Cloud infrastructure.Kubernetes and OpenShift AI.GPU orchestration.Databricks and data pipelines.RAG and LLM integration.MLOps and CI/CD. Security, observability, and governance. Automation with Ansible, Terraform, and GitOps. This is where AI becomes real. The winners will not be the teams with the most experiments. They will be the teams that can turn experiments into reliable platforms, measurable business value, and repeatable operating models. That is the conversation I’m excited to have. So, people of NYC: DM me. I’m happy to meet for a coffee and discuss the future of AI, cloud-native platforms, automation, and what it takes to bring enterprise AI from concept to production. See you soon, Luca #AI #MLOps #CloudNative #Kubernetes #OpenShift #Automation #DataPlatforms #NewYork #EnterpriseAI
0
0

1-30 of 339
powered by

skool.com/ai-devops-ansible-community-6317
AI Platform Engineering Lab by Luca Berton: hands-on AI infrastructure, Kubernetes, OpenShift AI, GPUs, MLOps, RAG, Ansible & Terraform for engineers
Suggested communities
Powered by