Activity
Mon
Wed
Fri
Sun
Jul
Aug
Sep
Oct
Nov
Dec
Jan
Feb
Mar
Apr
May
Jun
What is this?
Less
More
Memberships
Masterminds for Skool Owners
60 members • Free
Clief Notes
39.5k members • Free
Expert Coach Certification
22.5k members • Free
10 contributions to Clief Notes

11h •
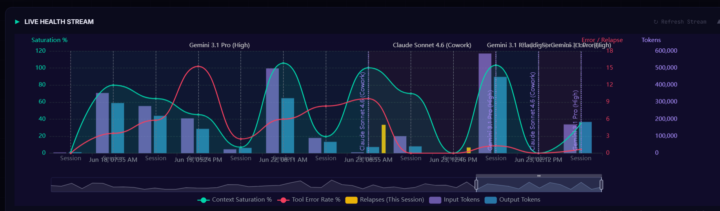
How I measure my Session Health
my Live Health Stream is a real-time telemetry dashboard designed to monitor the "cognitive load" and operational stability of autonomous AI agents across different sessions and models (e.g., Gemini 3.1 Pro, Claude Sonnet 4.6). I am using both AntiGravity and Claude Code. They write to my obsidian vault, and my dashboard is a HTML/CSS version of that data along with python scripts that aggregate my json data for metrics I want to measure. Tool Error Rate % (Red Line) - What it is: The frequency at which the agent is failing to execute its tools properly (e.g., syntax errors, bad file paths). - How it’s calculated: (Failed Tool Calls / Total Tool Calls in the session) * 100. Notice on the graph how the red line spikes almost immediately after the green saturation line peaks. Context Saturation % (Green Line) - What it is: A measure of how "full" the agent's brain is getting. - How it’s calculated: (Total Input Tokens / Model's Maximum Context Window) * 100. If this hits 100%, the agent starts forgetting earlier instructions (context eviction). Lessons Learned (Yellow Bars) - What it is: The number of times an agent gets caught in a recursive failure loop (trying the exact same failed action over and over). - How it’s calculated: Programmatically tracked by analyzing the execution log for identical, sequential failed tool calls within a single session. I have a "Lessons Learned" log that I have my agents read on boot, and then if they **** up they have to record a lesson there, and update the .json file for that session where i build this graph from. Input/Output Tokens (Blue/Purple bars) Since this is not exposed I have to do an estimate: "input_tokens": input_bytes // 4, "output_tokens": output_bytes // 4, One of my core philosophies is No Vanity Metrics, and another is Things that are Measured Improve, and Ultimately, The Most Important Things Cannot Be Measured.
0 likes • 3h
@Patrice Roatan Quebecois Thank you. Question, are you a native English speaker? Your replies seem ver detailed and formal, almost like you are using an AI to create them. NBD, just curious!
4h •
Added Wikipedia-Like Read | Edit | History| Talk to my obsidian vault
I have built a web-based dashboard for my vault, so I built an interface just like mediawiki to view, edit, and track changes/history of ALL my vault files. I track all changes via git, and really like to know the history of who changed what when and why. It works just like mediawiki now. The .md files stay .md and the agent doesn't have to read extra meta data, that is all kept separate and attached at assembly on the web side. The talk page is where i can send prompts specific to that page to my agent and track the conversation.
2
0


23h •
Does your system go to the gym?
The way we build has been on my mind lately. Part of it was @Ruben Aguirre ’s post about memory and drift and the system getting away from him. Part of it was a conversation with @Curtis Hays. Curtis kindly gave me permission to share the following, which is all his: The frame is the one from the thread @Geoff Thilo started. Two layers everybody can see: where the work lives (the folders), and what the model can see when it acts (the context loading). There's a third nobody builds for — discipline. What keeps the first two true after the day you set them up. People conflate organizing files with keeping them true over time. They're not the same job. I keep an index of every client and which version of their brand doctrine is current. I wrote it once. Then a few weeks later I touched it once more for an unrelated change. That was it. Two edits in two months while the actual client work churned underneath it — new versions, new clients, a half-dozen files that moved. By today the index was just wrong. It froze on the day I wrote it and the world walked past it. Here's the part worth noticing. It didn't go stale because I got lazy. It went stale because nothing in the system owned keeping it current. No rule, no gate, no step that said "when a doctrine file changes, the index re-derives." I went looking — there was nothing. It was a hand-built snapshot with no maintenance contract attached. An artifact like that was always going to freeze. The only question was how fast. So that conversation from Curtis got me thinking. I build a lot slower than some people in here - and I’ve already tagged two of them in this post. Part of that is because I spend time worrying about what Curtis calls the discipline. I stop and think about the boring stuff when I build. How is it going to get maintained? Does the skill force it or suggest it? I run a fortnightly reflection for my personal system. For my work one, I run a weekly sweep *and* a fortnightly reflection. I think the discipline is important enough that I baked a version of this into a competition entry in here - adjusted from my own practice to suit use by someone who is not a builder and stop the system from disintegrating over time.
1 like • 12h
@Caleb Owens how has this evolved for you? Meaning, how did you start?
13h •
How to do research?
I am wondering if there is an ICM framework for doing research? For example, if I am researching a topic, i want to know the top websites, apps, books, authors, criticism, demographics, etc. for that topic or domain. What are you all using? Can you show me examples? Is this a workflow that someone could or would build out and license/sell?

2d •
made my first 40 cents thanks to Jake and ICM!
used the methodology to code my first crazy idea, a digital "Jump to Conclusions Mat" from Office Space. I posted it to reddit, and the very first day I made .$40! This is probably the DUMBEST and most POINTLESS game on the internet, but hey, the guy who made pet rocks made a million dollars! I was so excited I can't even tell you! https://jumpoff.space/?utm_source=icm
1 like • 18h
Thanks @Patrice Roatan Quebecois
1 like • 16h
@Oscar Setiawan nice gif. Ty
1-10 of 10

@peder-halseide-4329
Use my second brain to create real things in the real world and to have difficult conversations. I build caskets, I run, and I lead workshops. 7 kids.
Active 2h ago
Joined Jun 17, 2026
INTJ
Fort Collins CO
Powered by