Activity
Mon
Wed
Fri
Sun
Aug
Sep
Oct
Nov
Dec
Jan
Feb
Mar
Apr
May
Jun
Jul
What is this?
Less
More
Owned by Options
STOP trading market direction. Start using options strategies to turn volatility into steady income. We sell premium, and think in probabilities.
Memberships
AI Options Trading Lab
26 members • Free
Options Made Simple Webinar
1.4k members • Free
Options Auto Trader
578 members • Free
Trading 101: Stock Options
111 members • Free
Options Trader Network
8 members • $97/month
TRADING MADE SIMPLE by Ali
1k members • Free
OptionMasters
27 members • Free
Option4All
59 members • Free
Imperium Academy™
70.7k members • Free
47 contributions to Options Jive

4d •
[Help Me Build This #2] You Decide How Much I Fund the Model Portfolio With
You've already seen my personal portfolio and the hedge fund book side by side, and I post many trade ideas from both my personal account and our audited fund. However, what happens after is what matters more: how to roll, how to adjust and transform trades, how to neutralize delta, how to hedge, how to recenter as the market moves, and how to repair trades that went wrong. That's what the real Model Portfolio is going to show. You already pushed me toward this idea in the previous survey. Now I'm funding a real account at a real broker and running it completely in the open. Summer engagement and market participation both run lower here, and a launch like this needs everyone paying attention. So I'm targeting mid-September. How I deliver all of this in real time is still something I'm working out. I'm exploring whether I can provide premium subscribers with read-only login and password, allowing you to log in anytime and see the actual portfolio directly: positions, P&L, buying power, Greeks, and adjustments. I still need to determine the safest and most practical solution. Two decisions left before I lock it in. Question: How big should the real Model Portfolio be? Vote for the size that teaches you the most. Bigger doesn't automatically mean more useful to watch.
Poll
5 members have voted
2
0
7d •
I simulated TQQQ back to QQQ's 1999 launch
Many people here trade options on leveraged ETFs. I simulated TQQQ back to QQQ's inception in March 1999, with financing costs and the fund's expense ratio built into the model. Almost every leveraged ETF discussion eventually runs into assumption 3x daily leverage should produce something close to 3x the long-term return. The pre-2010 series models 3x daily exposure to QQQ, with financing costs on the borrowed notional and the fund's expense ratio subtracted daily. Starting in 2010, the simulated series is spliced directly into TQQQ's real, traded adjusted price history, so everything after that point comes from actual market data. The results, $10,000 invested in March 1999: - QQQ: $10,000 → $167,265 (11% annualized) - TQQQ (simulated pre-2010, real data after): $10,000 → $24,569 (3.4% annualized) Maximum drawdown over the same 27 years: - QQQ: -82.96% - TQQQ: -99.98% A -99.98% drawdown means every $10,000 fell to $2. TQQQ carried far more risk the entire way and still finished with $14,569 in total profit against QQQ's $157,265, under 10% of the unleveraged return. The volatility drag (beta slippage) scales with the square of the leverage multiple. So double the leverage and the drag roughly quadruples, triple it and the drag runs close to nine times larger. That is why I don't trade options on leveraged ETFs. You would be layering theta and IV risk on top of an instrument that is already decaying by design and has never been tested by the environment that would break it.
2
0

10d •
Using This Week's Earnings Volatility to Buy REITs for Retirement
Since 1991, REITs and the S&P 500 have delivered almost the same total return, but the engine was completely different. Most options traders never notice this. REITs are boring. Theta is not. I used this week's earnings-volatility spike to get paid extra for buying real estate at my price, instead of whatever price the market hands me on a random Wednesday. Active trading builds the war chest. Boring trades like this help build your net worth. You need both.
2
0

16d •
No trade today. The Relative Rotation Graph is live
No trade breakdown today, I just launched something better: the tool I use before I touch a single strike. Relative Rotation Graph tools are usually paid, and I made this one free for you. No login required, no catch. The Relative Rotation Graph tool is now live. Why? Because stocks don't move alone. Capital rotates by sector first, and stocks follow. I check this exact chart before every trade idea I write. A strong company can struggle when its own sector is under pressure. An average stock can run simply because capital is flowing into its industry. When the sector tide rises, most stocks inside it rise with it. When it turns, even good names get pulled down. A tide is one gravitational pull acting on an entire ocean at once, but it does not hit every coastline the same way. The open Atlantic side of Nova Scotia may rise a meter or two, but The Bay of Fundy, only a short distance away, can swing by as much as 16 meters under the same moon. The difference is resonance. The bay's shape and depth match the rhythm of the incoming tide so closely that each surge reinforces the last. Markets work the same way. A rate decision, an inflation print, an earnings cycle, or a growth scare can hit every sector at once. What changes is how much each sector amplifies or absorbs it. Moskowitz and Grinblatt tested this directly in their Journal of Finance paper: "Do Industries Explain Momentum?". Their finding was rough on pure stock-picking ego: much of what looks like individual stock momentum is really industry momentum in disguise. Buy the winning industries, short the losing ones, skip individual stock selection entirely, and the effect still holds. The RRG puts that tide in front of you before it reaches a single stock's chart. Why this matters for options For options traders, sector rotation changes the odds behind a trade before you even choose strikes. It helps you avoid selling premium blindly into strong directional momentum. It helps you find better, more liquid candidates for credit spreads, diagonals, ratio spreads, covered calls, Jade Lizards, and earnings trades. It also shows you when a setup is not really about the stock at all, but about the sector tide underneath it.

29d •
I've Been Watching India for Months. I'm Finally In (Small Account-Friendly)
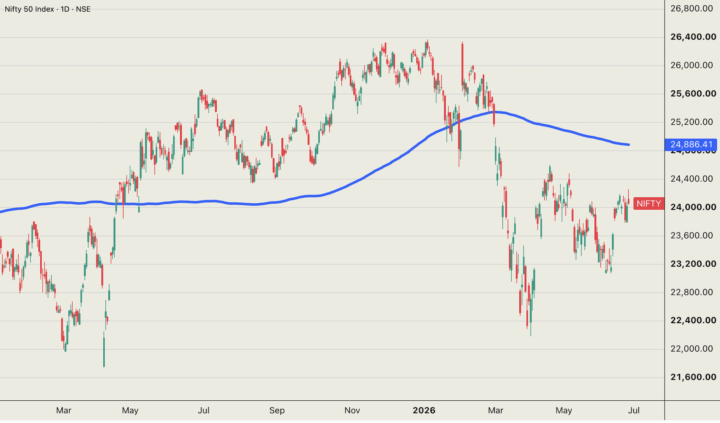
I've been watching India for months. India is currently the world's fastest-growing major economy: 7.7% real GDP growth last fiscal year, inflation at 3.4-3.9% inside the RBI's 2-6% target, and a domestic equity market that has become one of the most watched in emerging markets over the past years. For US options traders, the cleanest way to access it is INDA, iShares' USD-denominated ETF tracking India’s large-cap equity market. Think HDFC Bank, Reliance Industries, Infosys, ICICI Bank. The domestic consumption and financial franchise story, packaged into something a US brokerage account can touch and trade options on. INDA peaked at $58.53 last year. It's now sitting at $49.55, a 17.82% drawdown, near its 12-month low of $48.10. The economy didn't slow down to cause that. That gap between price action and fundamentals is my trade. That divergence is what I've been watching. Here's what I found. An 18% drawdown at 14% realized volatility INDA fell from $58.53 to $48.10 over the past year at an annualized 30-day realized volatility of approximately 14% (!). That number tells you something specific about how this market moves. It's a grinding multiple compression that played out over months, driven by foreign institutional investors rotating out toward cheaper Asian peers as India's premium vs. the region became harder to justify. The Nifty rerated from well above its 5-year trailing P/E average down to roughly 22.7x, below that 5-year average of 24.5x. The economy kept growing, but the multiple compressed. India has been falling slowly enough that every step has been manageable. The fear on the surface is not episodic Front-month IV sits at 16-18% against that 14% realized volatility. IVR at 37. A modest spread. Put demand on INDA doesn't build around events; it builds around risks that never fully clear. India’s equity premium vs. regional peers can compress without any fundamental catalyst. FPI outflows can accelerate on relative-value decisions that have nothing to do with Indian GDP. The rupee has been on a persistent multi-year depreciation in USD terms. None of these risks expire with the option. They reload every cycle.
4
0
1-10 of 47
