Activity
Mon
Wed
Fri
Sun
Aug
Sep
Oct
Nov
Dec
Jan
Feb
Mar
Apr
May
Jun
What is this?
Less
More
Memberships
InvestCEO Boardroom
793 members • $10,000/y
🇺🇸 Chicago IRL
421 members • Free
InvestCEO with Kyle Henris
45.1k members • Free
54 contributions to InvestCEO with Kyle Henris

👑
16d •
🏅What opportunities are available?
On tonight's session I covered all the opportunities for those interested to get involved in the automated trading algos, day trading coaching, and my wealth management firm. You can check out the recording here :) In addition here are the links I mentioned to get started: ✅Freedom Formula Skool group ("Group 1") - Automated prop firm algos on unlimited evaluations/firms - Day trading coaching pods - Daily plans and reviews from me https://www.skool.com/freedomformula/about ✅Freedom Formula Wealth Management ("Group 2") - Unlimited access to use the algo on prop firm PAs - Financial freedom plan/roadmap (asset strategy, cashflow strategy, tax strategy, etc) - Full service asset management - Access to my private hedge fund https://kylehenris.com/freedomformulawealth

0 likes • 12d
@Tana Whicker delete me 😂
0 likes • 12d
@Tana Whicker no I meant the email!

Nov '25 •
Monday Money Tips (11/24/2025)
"The Third Account Most Parents Never Use For Their Kids" This Monday Money Tips is best read in the Classroom (click HERE). Feel free to leave your questions and comments below.
1 like • Nov '25
Thank you for doing this every week for us Rico. Really awesome stuff

Nov '25 •
Supply & Demand Blocks
I am confused on if I am drawing supply/demand blocks on the daily or 1hr chart as they are both spoken about. Can somebody please clarify this for me. Thanks in advance.
3 likes • Nov '25
There is no magic time frame, but if youre going by what is taught in this course, youre drawing your supply and demand blocks on the 1 hr chart. The Daily is great for identifying a market trend and a bias as far as where a more ideal premium or discount zone may be, then from there identifying more significant supply and demand on the 1hr, 2hr, 3hr, 4hr whatever, depending on the picture it creates. Sometimes changing the time frame will allow you to see something more clearly.

Nov '25 •
TopStepX help
Does anyone know how to use TopStepX? Im used to papertrading on TV and was expecting the same MARKET/LIMIT/STOP sort of panel...but instead it looks completely alien! I cant figure out how to just set my limit orders with SL and TP prices. Or really how to set a trade at all on this platform, it feels very un-user friendly. Would appreciate any explaination
2 likes • Nov '25
@Rose Ertz Go to the Classroom and start with START HERE. Watch them all. Everything you could possibly need to get started is there.

Nov '25 •
DID I DO THIS RIGHT ?
Can I get some feed back? I entered the second candle in my demand block.
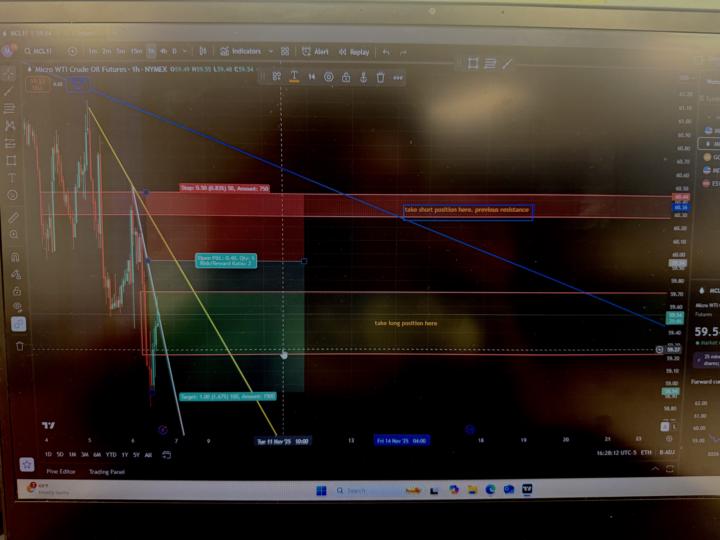
0 likes • Nov '25
Which way are you looking?
1-10 of 54

Active 9h ago
Joined Apr 14, 2025
Ft Lauderdale, FL
Powered by