Activity
Mon
Wed
Fri
Sun
Apr
May
Jun
Jul
Aug
Sep
Oct
Nov
Dec
Jan
Feb
Mar
What is this?
Less
More
Memberships
Excel Analytica
249 members • Free
MPM Job Hunt - ELITE
342 members • $361/m
2 contributions to Excel Analytica

Dec '25 •
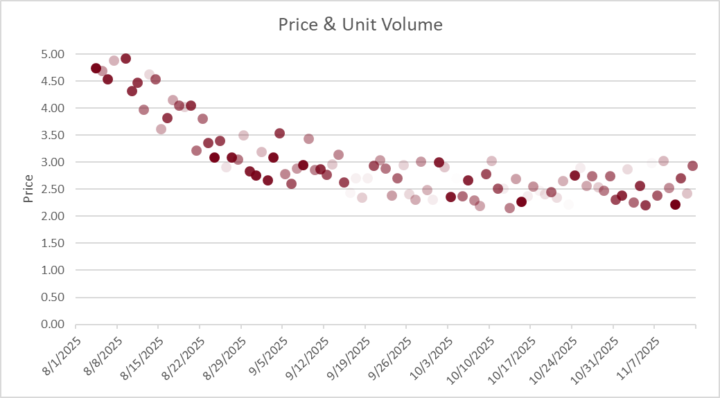
What Excel Creation from 2025 are you Proud of?
I know some of us do most things at work and may not be able to share a screenshot (myself included) but let's hear what are the amazing things you've created / done in Excel this year! I'll Start us off. ⬇️ _______________________________________________ I do a lot of work in forecasting and analysis and showing how a metric trends over time (like a product's price) is pretty standard. Line charts work, dot plots work also. But I also needed to show how many units were getting sold each of these days. You can overlay a bar chart, and that works, but visually communicating volume works great if each dot gets lighter with less volume. And that's what this chart does. Solid Dots have high volume. Very light dots have very little volume. Your eye immediately sees where volume is greatest, and has the biggest effect on results. I used this visual to help explain a hot-button issue and it immediately got shared with executives in multiple departments — big credibility booster. What's something you're proud of? — New Function You Learned — Process you improved — Challenge you Overcame

2 likes • 21d
Nice to know
21d •
Introduction
Hello guys , Darsh here an MBA graduated and new here looking forward to improve my skills. Thanks
0
0
1-2 of 2

Active 12h ago
Joined Feb 25, 2026
Powered by