Activity
Mon
Wed
Fri
Sun
Aug
Sep
Oct
Nov
Dec
Jan
Feb
Mar
Apr
May
Jun
What is this?
Less
More
Memberships
AI Automation Society
418.9k members • Free
5 contributions to AI Automation Society

1h •
Cancer Research Journey: From Grok to Claude + Code
Over the past six months, I dedicated significant effort to cancer research using Grok, focusing on microfluidic biochips, single-cell separation, and CTC detection technologies. While Grok proved to be a capable and insightful AI assistant, the inherent complexity of oncology—spanning molecular pathways, heterogeneous data, and multi-omics integration—often demanded extensive manual refinement, repeated iterations, and additional validation steps. However, after integrating Claude AI with coding capabilities, I discovered a far more efficient platform. This combination has dramatically streamlined literature synthesis, data analysis, workflow automation, and hypothesis generation. As a result, I can now complete future research projects in half the time or even less effort compared to using Grok alone, accelerating progress in precision oncology and enabling faster translation of complex findings into practical applications. You can click the link of my cancer research detail as follow: https://www.linkedin.com/pulse/unveiling-comprehensive-cancer-insights-solo-journey-data-danny-chan-coosc/
0 likes • just now
@Achille Goerger My Six-Month Cancer Research Journey Over the past six months, I began an in-depth cancer research project using Grok. I opened a dedicated long-term conversation and systematically asked nearly 300 questions to understand cancer mechanisms, detection technologies such as microfluidic biochips and CTC analysis, and global epidemiology challenges. While Grok provided structured explanations, the complexity of oncology required extensive manual clarification and iteration. I then shifted focus to data collection, where I discovered that global cancer statistics were highly fragmented across sources, with inconsistent years, formats, and mostly country-level data only. Using Excel’s Power Query, I merged multi-year incidence, mortality, and prevalence data from dozens of sources into a unified structure. I standardized country names, cancer types, and fields, then built a three-layer database: raw CSV as the foundation, Excel for processing and cleaning, and Power BI with DAX for dynamic analysis and visualization. To overcome the limitation of country-level data, I used complex formulas to simulate city-level insights by integrating hospital resources and population indicators. Supporting metrics such as cure rates, recurrence, and treatment methods were linked to each cancer type for greater accuracy. The major breakthrough occurred when I combined Claude AI with coding capabilities. This hybrid approach reduced my overall research time and effort by more than half compared to relying on Grok alone, allowing faster data integration and deeper exploration of complex cancer topics.

💎
⭐
Oct '24 •
Welcome! Introduce yourself + share a career goal you have 🎉
Let's get to know each other! Comment below sharing where you are in the world, a career goal you have, and something you like to do for fun. 😊
2 likes • 2h
As Co-Founder of Synthesis Innovation Ltd, I oversee distribution businesses across Europe and lead complex data research and migration projects. I specialise in Power BI, Excel, DAX, and Power Query to transform raw data into clear, actionable insights that support strategic decisions. It is a great pleasure to join this community. I look forward to continuously improving my skills, exchanging ideas, and exploring new opportunities in AI business and intelligence with fellow professionals.
1 like • 2h
@Frank van Bokhorst I am from Hong Kong. With my two past projects, I have conducted climate and cancer research for the global market. If I can use the Claude AI platform, I can reduce my effort and time with a template AI to standardize my consultancy projects in the future.

2h •
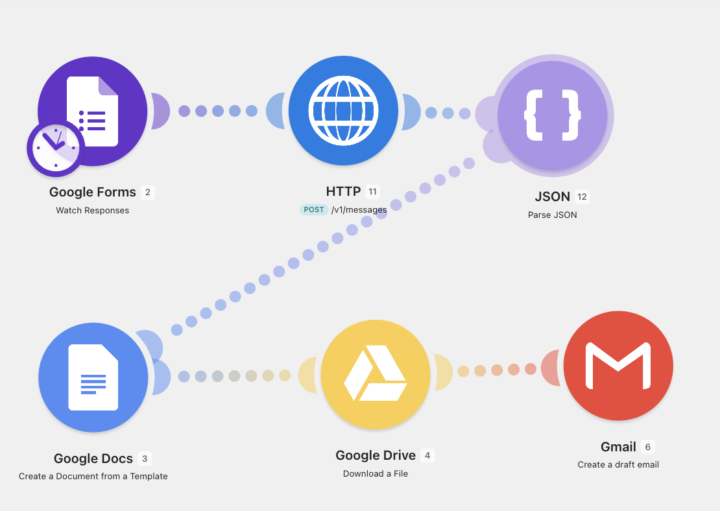
Day 4: Automation for Real State Workflow
Hi everyone, here is my deliverable for the Day 4 challenge: an automation for Real State Business. Because I have been already working with Make, I used this tool instead of trigger.dev. Feel free to ask for the Make scenario, of course its completely free!!! The flow automates the full property quotation process for a real estate business: the agent fills out a Google Form with the property data and three market comparables, and Make takes it from there. Claude generates the analysis — SWOT, sales strategy, price justification and average $/m² from the comparables — which gets merged into a Google Docs template along with an embedded map of the property, converted to PDF, and dropped as a Gmail draft ready to send. I think the two design decisions that matter: the email stays as a draft, not an auto-send — the agent reviews and hits send, so there's always human control over what reaches the client. And AI only does the reasoning; the document assembly and delivery are deterministic. What used to take 1–2 hours now happens in about 2 minutes. Have a nice Sunday !!!
2 likes • 2h
Congrats. Currently, I mainly used Grok and Gemini for complex research but I want to migrate to Claude platform for establishing my AI agent.

🔥
2d •
🏆 Weekly Wins Recap | June 27 – July 3
From $40K AI projects and first clients to custom CRMs, AI operating systems, and production-ready automations, another week inside AIS+ proved that consistent building keeps creating opportunities. 🚀 Standout Wins of the Week inside AIS+ 👉 @Kobe Shemesh closed a $40K upfront AI project after refining his Claude Code workflow, proving that small improvements in execution can create massive business results. 👉 @Galyn Fergerson landed her first client just 6 days into AIS+, turning a discovery call into a $750 AI OS project before even finishing the automation course. 👉 @Girish Mohan built an AI Scrum Master that now prioritizes his calendar, tasks, and deals automatically—helping him execute every day with more focus. 👉 William Rendall was promoted to AI Workstream Strategy Lead less than three months after joining AIS+, crediting the community for accelerating his growth. 👉 Diane McCracken celebrated her 100th Claude Code session at 68 years old, showing that curiosity and consistency matter far more than experience. ⸻ 🎥 Super Win Spotlight | @Ahmad Abd Alkarim Ahmad joined AIS+ with years of leadership experience but wanted a better way to turn ideas into action. Today, his custom AI Operating System helps him manage projects, analyze business problems, and support his team without slowing anyone down. His biggest lesson? Don't just watch. Build. Practice. Share what you learn. That's where the real return comes from. 🎥 Watch Ahmad's story 👇 ✨ Every week, members are turning ideas into systems, skills into businesses, and momentum into real opportunities. Step inside AI Automation Society Plus and start building assets, systems, and skills that compound 🚀

2 likes • 2h
Congrats. Currently, I mainly use Grok and Gemini for complex research, but I want to migrate to the Claude platform to establish my AI agent. With my two past projects, I have conducted climate and cancer research for the global market. If I can use the Claude AI platform, I can reduce my effort and time with a template AI to standardize my consultancy projects in the future.
💎
⭐
9d •
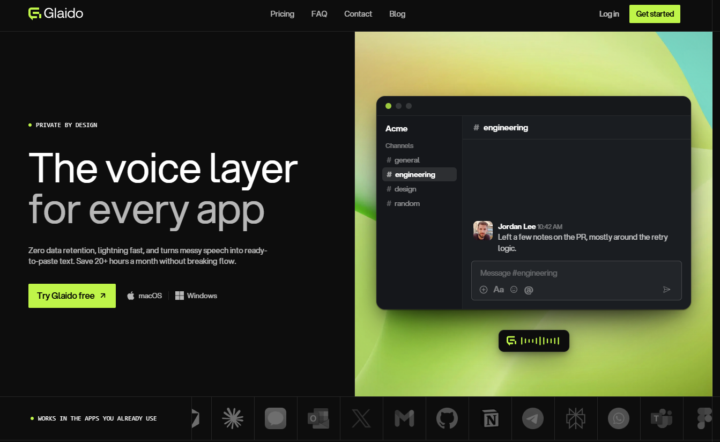
🎉LIMITED TIME try Glaido FREE, then 40% off.
I'm a co-founder of Glaido, building it with Jack Roberts, Dave Ebbelaar, and Jannis Moore. It's a voice tool built around two things: speed and privacy. Fastest on the market, completely private. It used to be Mac only. It's now on Windows too, so all of you can use it. You get 40% off your first 3 months ($20/mo → $12/mo) with this code: D5J6BIF8K4P Next 30 days only 👉 https://get.glaido.com/nate I switched from Wispr Flow a few months ago and it just felt better. If you're on Wispr, try Glaido free, use the code, and tell me if you feel the difference. If you want to switch back after, no hard feelings. Good to know - Mac + Windows - Snippets: insert any text instantly with one word - Dictionary: save your own words, import straight from Wispr Flow - Agentic Mode: manipulate any text on your screen with your voice - Webhooks coming to Agentic Mode soon (huge) - We action feedback almost immediately Give it a shot and drop your thoughts in the community.
0 likes • 2h
Nice one
1-5 of 5

@danny-chan-1704
C-level executive with 20+ years in business development. Power BI data specialist who led complex AI research in cancer and global climate.
Online now
Joined Jul 5, 2026
ESFJ
Hong Kong
Powered by