Write something

🔥
17h •
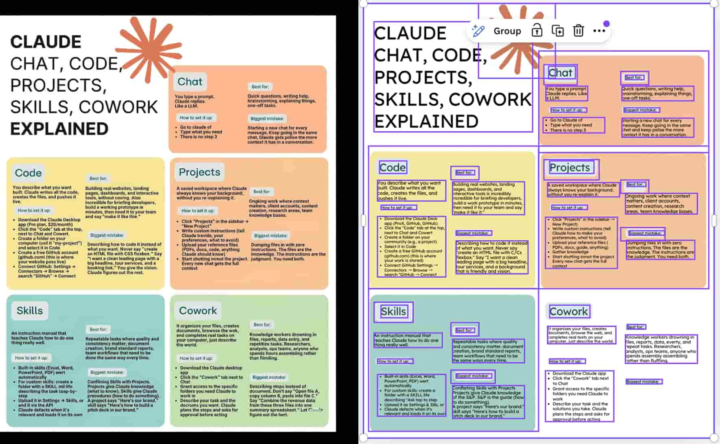
Want to generate editable infographics with AI
Here's how you can generate editable infographics with AI easy peazy - Use ChatGPT or Claude and prompt: - Pick the best concepts and ask: - Paste prompts into Gemini and generate a few variations - Download the best PNG and upload to Canva - In Canva, use Magic Studio → Magic Layers to make it editable - Clean up text, fix visuals, improve hierarchy, and tighten layout - Export and post across platforms
🔥
1d •
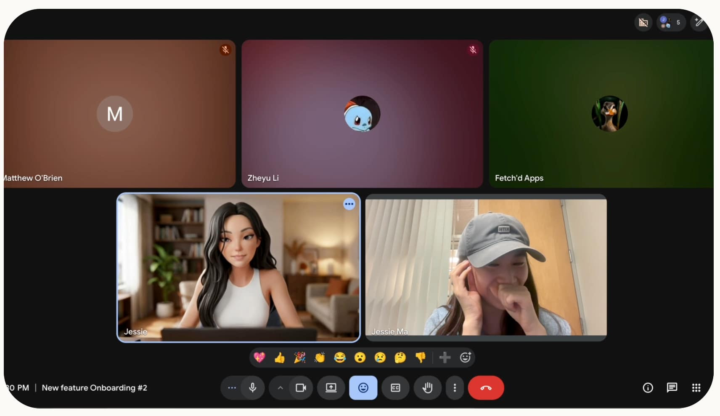
Want to do live video calls with your own AI agents.
Here's how you can to do live video calls with AI agents - Go to Pika AI Self and create your living avatar. - For other agents, you can download the Skill on GitHub here. - Go to ‘Skills and Connections’ > ‘Real-time Video Chat’ > ‘Try Now’ - Now simply invite them to a Google Meet using a meeting link. - Your Pika Self will join the call and carry on conversations with your personality and taste.
🔥
2d •
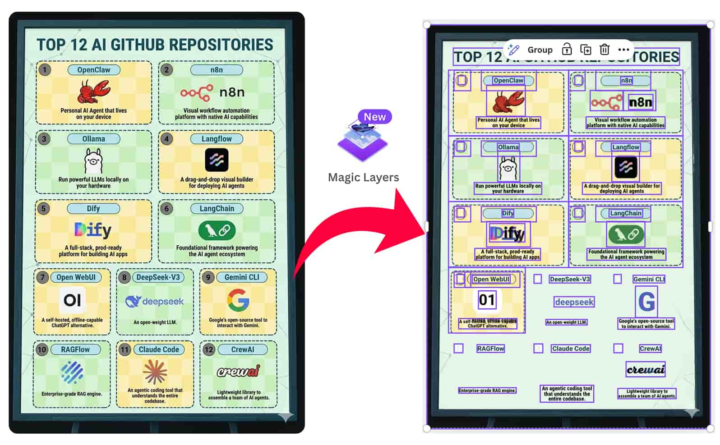
Want to turn any flat image into an editable design?
Here's how you turn any flat image into an editable design - Open Canva → go to Magic Layers, click Select Media, and upload your image - Wait ~30–60 seconds. Canva automatically detects layout, text, objects, and background, and separates everything into editable layers - Click any layer to edit instantly. Update text, fix typos, change dates, or tweak taglines without rebuilding the design - Select object layers to move, resize, duplicate, or remove elements with full control - Drag in a new image (product shot, logo, etc.). It snaps into the existing layout automatically - Fine-tune the design by adjusting colors using the color picker to match your brand or style
🔥
4d •
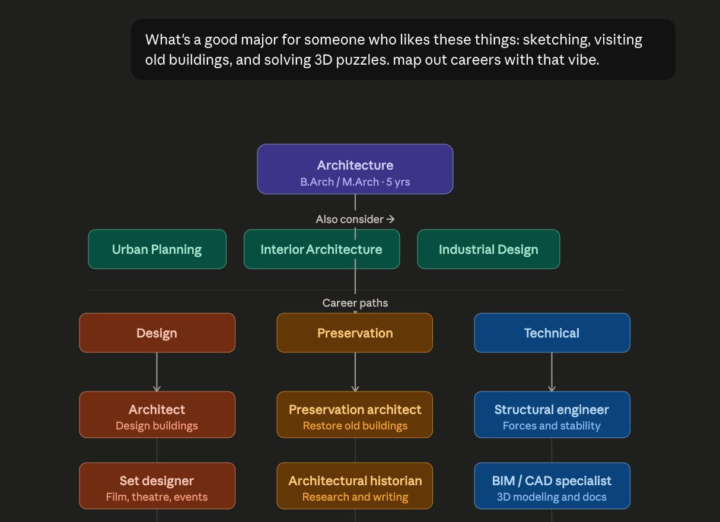
Want to create interactive charts and diagrams in Claude
Here's how you can create interactive charts and diagrams in Claude - Go to Claude - Select ‘Sonnet 4.6‘ as your model and enter your prompt Sample Prompt: What's a good major for someone who likes these things: sketching, visiting old buildings, and solving 3D puzzles. map out careers with that vibe. - Within seconds it will generate an interactive flowchart for you - Tap any path to explore deeper
1-30 of 213