

12h •
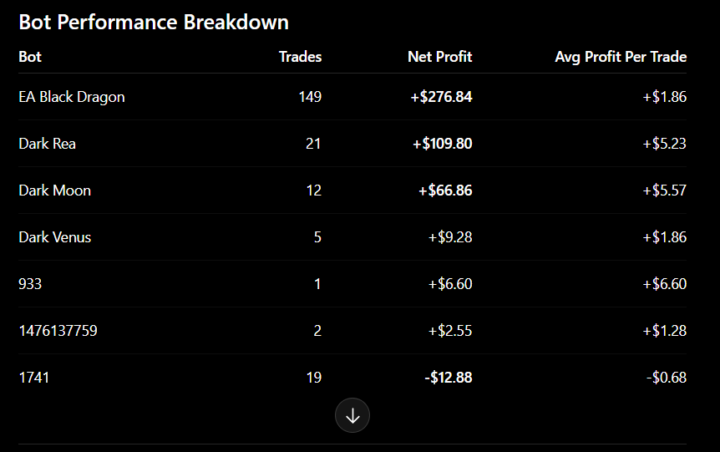
Bot performance breakdown
TLDR Dark Rea on USDCAD WINNER this week. This weekend I will look at either raising the lot size or implementing more bots on USDCAD. Double lot size for GBPUSD on Black Dragon from 0.01 -0.02 Keep Dundee 1741 only on USDCAD. Half lot size and lower TP. Dark Rea Keep USDCAD. If next week USDCAD is still performing I will increase lot size. Half EURUSD lot size. Might keep Dark Moon EURUSD, USDJPY So as I posted earlier Dark Moon seems to have slippage issues (for me) on Gold so I have removed it from mine. EA Black Dragon — Winner Overall (But this was me practicing) - Massive trade count. - Mainly carried by XAUUSD scalping. - Very high consistency. - A lot of tiny quick exits. - Several losses, but statistically overwhelmed by win frequency. Dark Rea — Strong Secondary Performer - Total Profit: +$109.80 - Fewer trades. - Much higher profit efficiency per trade than Black Dragon. Best Performing Pairs - USDCAD - EURUSD Biggest Issue Dark Rea had: - Some excellent scaling entries - But also held losing EURUSD baskets too long overnight Dark Moon — Quiet but Efficient - Total Profit: +$66.86 (should be more but slippage cost me on gold) - Low trade count. - Good average trade quality. Strength - Much cleaner entries than 1741 - Better timing on USDJPY and EURUSD Dundee 1741 — Worst Performer - Net Result: -$12.88 - Negative expectancy. - Large drawdown trades. - Most inconsistent behavior. Major Problems This bot was responsible for several bad losses: - USDCHF: -37.58 - USDCHF: -22.98 - USDJPY: -20.88 The wins were: - Smaller - Slower - Lower quality Statistical Issue 1741 appears to: - Chase continuation late - Enter during exhaustion - Hold too long when wrong
0
0
23h •
I removed Dark Moon
This doesnt happen a lot but It does happen to me at least. I am getting slippage after the trade closes in profit. If you are not getting this issue then you can keep it. Its disappointing as it usually does well. But just cant afford someone else's mistake when It should be in profit
2
0

2d •
How to back test an EA
https://www.youtube.com/watch?v=T7eJklFHwxA Important to assess if the settings are working and work out what the correct lot size you need for acc size.
2d •
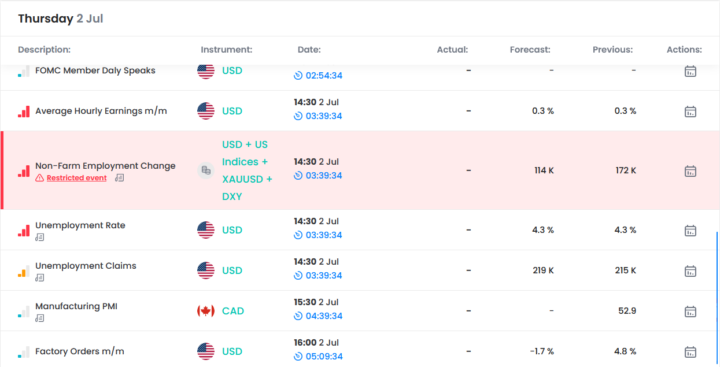
NFP today
turn off or monitor acc. This is the biggest news event of the month. This WILL spike markets and cause chaos for a bit. Best not to be a part of it. Too much manipulation this year. 3.5 hrs to go. prepare to close trades when they reach any profits. Manage DD as we get much closer to News. If you are manually trading. 'Only trade what you see. Not what you think.' Only follow the trend today AFTER the news. And watch out for big reversals. NFP Blows more accounts than it makes people rich. 🙏
1-30 of 117
powered by

skool.com/winwin-2512
A results-driven trading community developing manual, automated strategies, leveraging time, risk management to build multiple scalable income streams
Suggested communities
Powered by