

19d •
NEW VIDEO DROP!
Great morning all! A new video has been dropped in the Classroom section. Check it out and leave a comment on it on your thoughts.
Dec '24 •
Assignment #2
Blockchain Basics Research how blockchain works and share one cool fact you learned. Task: Post your fact in the comments and discuss its importance.

Nov '24 •
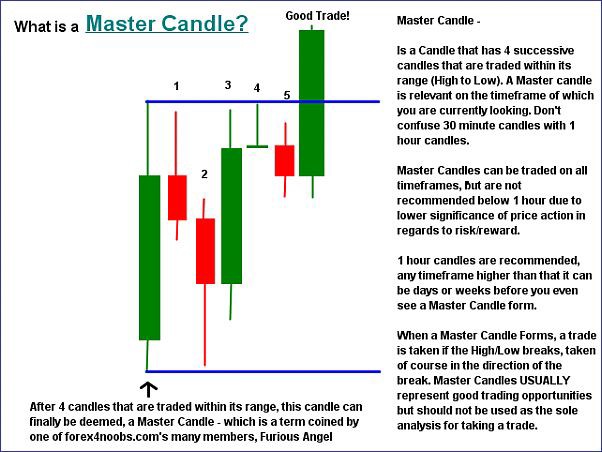
MASTER CANDLE BREAKDOWN
Here is a simple breakdown on how to trade using the master candle strategy
Nov '24 •
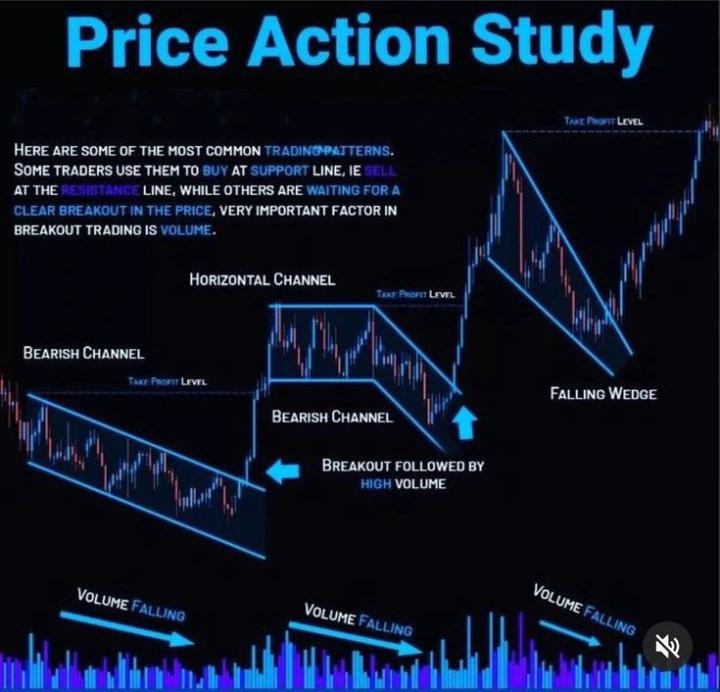
PRICE ACTION STUDY❗️
Price action in trading ✓refers to the analysis of a security's price movements over time. ✓ It focuses solely on the asset's historical price data to make trading decisions, without relying on technical indicators or fundamental analysis. ✓Traders who use price action aim to interpret the market's behavior by observing patterns, trends, and key price levels. Here's a detailed breakdown: Key Components of Price Action: 1. Candlestick Patterns Price action traders often use candlestick charts, which visually represent open, high, low, and close prices. Common patterns include: Pin Bars: Reversals with long wicks. Engulfing Patterns: Signals of strong momentum. Doji : Indecision in the market. 2. Support and Resistance Levels Support: A level where price tends to stop falling and reverse. Resistance: A level where price tends to stop rising and reverse. 3. Trends and Trend lines Uptrend: Higher highs and higher lows. Downtrend: Lower highs and lower lows. Sideways Trend: Consolidation with no clear direction. 4. Chart Patterns Continuation Patterns: Flags, pennants, and triangles. Reversal Patterns: Double tops, double bottoms, head and shoulders. 5. Price Zones Focuses on areas of high buying or selling pressure, such as demand zones (where buyers are strong) and supply zones (where sellers dominate). 6. Volume and Momentum Price movements are sometimes accompanied by changes in trading volume, which can confirm the strength of a trend. --- Advantages of Price Action Trading Simplicity: Avoids reliance on lagging indicators. Adaptability: Works across different markets and timeframes. Real-Time Analysis: Focuses on live price movements, making it dynamic. --- Common Price Action Strategies 1. Breakout Trading: Entering trades when price breaks above resistance or below support. 2. Pullback Trading: Entering trades after a retracement in a trend. 3. Reversal Trading: Identifying market turning points using candlestick patterns or divergence.
6
0
1-4 of 4

skool.com/unemployableacademy
Master crypto investing and trading with our comprehensive online course. Learn strategies, market analysis, and risk management with this Academy
Leaderboard (30-day)
1

+4
2

+3
3

+3
4

+1
5

+1
Powered by