
Write something

Mar 26 •
NAS100
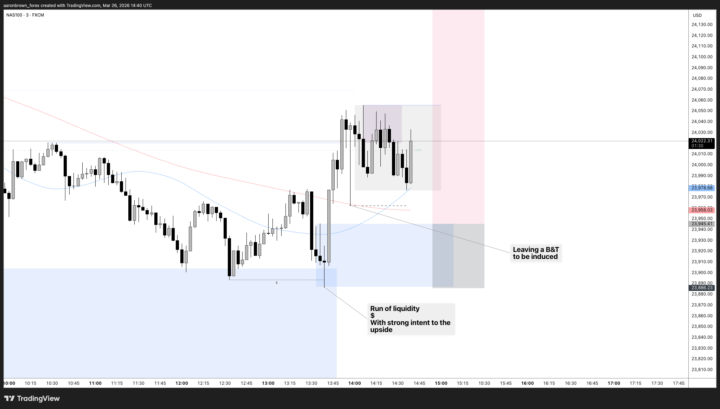
NASDAQ Long Trade Idea 📈 Overall, I’m maintaining a bullish bias on the higher timeframes (HTF) for NASDAQ. Price has recently pulled back into a key extreme demand zone, where we saw a liquidity sweep to the downside. This was followed by strong bullish intent, suggesting buyers stepping back into the market. After printing a clear break of structure (BOS), price came back to retest the area and continued pushing higher — a strong sign of continuation. This move likely trapped late sellers, especially as we saw a lower timeframe (LTF) SMT divergence, creating a false bearish reaction before moving into our limit. Key Confluences: - HTF bullish structure intact - Sweep of liquidity into demand - Strong displacement to the upside - BOS + clean retest - LTF SMT divergence indicating seller weakness - Seller trap / inducement into our entry Expectation:Continuation to the upside as long as price holds above the demand zone and maintains structure.
0
0
Mar 25 •
USDCAD - LONG
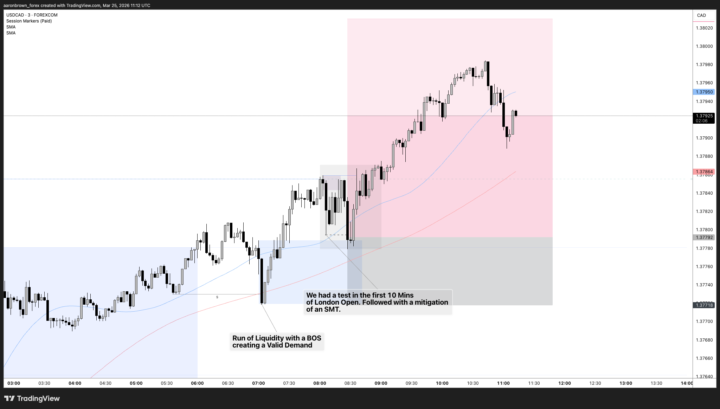
USDCAD Trade Breakdown (Targeting 1:3 RR) Currently, I’m targeting a 1:3 risk-to-reward setup on USDCAD, with both an aggressive and a conservative entry model in play. USDCAD is showing overall bullish market structure. During the Frankfurt Open, price swept liquidity to the downside, taking out sell-side liquidity before shifting direction with strong bullish intent. This move resulted in a clear Break of Structure (BOS), confirming the shift in order flow. Following the BOS, price retraced back into the origin of the move, effectively retesting the break of structure area. This pullback aligned with a Point of Interest (POI), where price also moved to mitigate a weak supply zone, creating a form of SMT divergence and trapping sellers who entered prematurely. Once price completed the break and retest into the POI, bullish momentum stepped back in, confirming continuation and providing entry opportunities. Entry Models: - Aggressive Entry:The aggressive entry was placed at the market structure low within the break and retest zone. This entry anticipates the reaction from the POI without waiting for full confirmation, allowing for optimal positioning and a higher RR.Target: 1:3 RR - Conservative Entry:The conservative entry was taken after confirmation, once price showed strong bullish intent and printed a secondary BOS to the upside. This provides additional confirmation at the cost of slightly reduced RR.Target: 1:2.5 RR Key Takeaways: - Liquidity sweep → BOS → retracement into POI - Seller trap formed via mitigation + SMT concept - Entry refinement based on confirmation vs anticipation - Clear bullish continuation framework
1
0
Mar 23 •
Silver Trade - Break Down
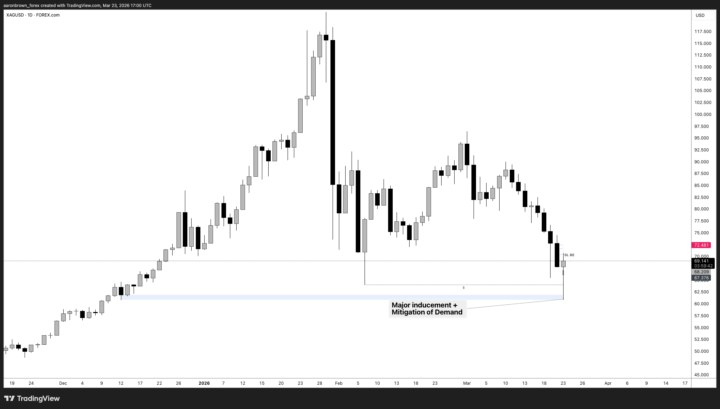
Silver Trade Breakdown (23rd March) We came into today with a clear bearish bias. As I mentioned in the Gold weekly roadmap, I had specific areas mapped out where I wanted to see price deliver into before considering any move back to the upside. However, this is exactly why we react to price rather than predict it. Market Shift & Inducement - On Silver, we saw a major inducement form, followed by a mitigation of a demand zone, which led to a strong 2-leg bullish push on the 15-minute timeframe. This type of price action is important because it signals intent — in this case, it showed that price was likely transitioning into a bullish phase, despite the initial bearish outlook. After the bullish expansion, price began reacting around the Asia high supply, where we saw: - Sellers getting trapped - Liquidity being taken to the downside - A sharp move back up, breaking above the Asia high This break and continuation effectively confirmed the S2D bullish zone. Entry Logic Following the break of structure (BOS) above the Asia high, price pulled back into the BOS area — a classic retest — before continuing higher. At the same time, we saw: - A Smart Money Trap (SMT) around previous supply - Further seller inducement - A push down into my POI (S2D zone) This created the ideal conditions for a continuation long. Execution This was a slightly more aggressive entry, even though the overall framework remained conservative. Instead of placing a limit order, I waited for confirmation that price still had bullish intent. We could clearly see: - Downside inducement - Strong reaction - Momentum building back to the upside That was the trigger. Risk Management & Outcome - Stop loss placed below the low - Took 50% partials at 1:3 RR - Moved stop loss to break-even (BE) at the first external high ✅ Result: - +1.5% locked in - Remaining position protected at break-even Key Takeaway Even though the initial bias was bearish, the market showed clear signs of bullish intent through structure, inducement, and momentum.
0
0
Mar 23 •
🇪🇺EURUSD🇺🇸 / 🇬🇧GBPUSD🇺🇸
Upcoming London Session Outlook 📊 As we approach our London Session KTW, we’re currently aligned with a Bullish DXY narrative, which supports a Bearish bias on EURUSD and GBPUSD. We’re seeing clear bearish intent on both pairs, with inducement highs formed during the final hour of the Asia session. This was followed by strong selling pressure and a confirmed break of structure (BOS)—a solid indication that sellers are currently in control. However, it’s important to stay disciplined here. Just because we have a bearish bias and early confirmation of selling pressure does not mean we rush into the market. Patience is key. We need to allow price to develop as we approach the KTW. Let the market build a clearer picture—look for additional confirmations, cleaner structure, and ideally a refined entry during our kill zone. Key reminders for today: - Don’t chase price - Let setups come to you - Trust the process, not the impulse - Execution > Emotion We react to what price does, not what we think it will do. Stay patient, stay sharp—let’s see what London delivers. 🔥
0
0
Mar 22 •
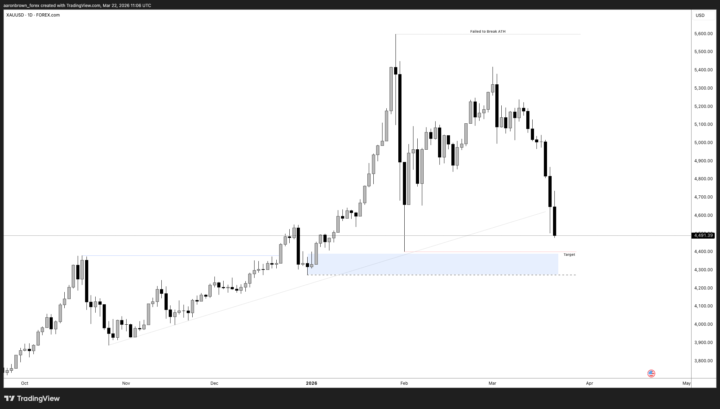
XAU/USD ROADMPAD
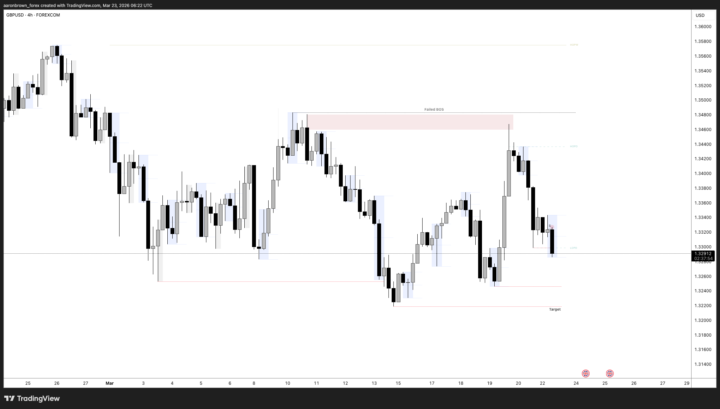
📅 Gold Roadmap: 23rd – 27th March (Pre-Week Outlook) Overall, the bias on Gold remains bearish, with a clear Higher Time Frame (HTF) target in mind. Below this HTF target, we have: - A valid demand zone - A Break & Test (B&T) sitting at the low of that demand This creates a strong framework for how price may deliver over the coming week. 🧭 3 Possible Roadmaps for the Week 1️⃣ HTF Target Sweep → Bullish Reversal Price may induce into our HTF bearish target, tapping into liquidity and mitigating the demand zone below. If we see the correct confirmations (shift in structure, displacement, etc.), this could mark the beginning of a move back to the upside, potentially targeting All-Time Highs (ATH). 👉 This would be the classic liquidity grab → reversal scenario 2️⃣ Deeper Liquidity Sweep → Expansion Higher Price could push through both the HTF bearish target AND the Break & Test level, sweeping more liquidity. This would allow price to tap into deeper demand zones, before finding strong buying interest and moving higher. 👉 Expect a more extended drawdown before the expansion 3️⃣ Bearish Continuation (Trend Holds) With the overall bias still bearish, price can simply continue trending lower without any major reversal yet. Key considerations: - There is significant trendline liquidity built up - Structure still offers lower levels to be taken - No obligation for price to reverse immediately 👉 This is the “follow the trend until it breaks” scenario 🧠 Key Reminder for the Week Understanding where price is likely to move gives you your edge — not predicting, but reacting with intent. There’s no need to: - Chase entries - Force trades - Be in the market at all times Let price:✔ Reach key areas✔ Show confirmation✔ Reveal its intention Then position yourself accordingly.
0
0
1-25 of 25

skool.com/the-liquidity-lab-5822
Liquidity and market structure simplified, high-probability setups, disciplined risk management, real trade breakdowns, and weekly planning.
Powered by