
Write something

Jul 18 •
IWM Daily game plan
🦁 IWM GAME PLAN | WEEK OF JULY 20–24, 2026 📖 Weekly Map • Weekly High: 297.81 • Weekly Low: 291.64 • Weekly Range: $6.17 • Weekly Midline: 294.73 • Weekly Bias: Bearish below 294.73–295.37 IWM finished the week at 294.04 after sellers pushed price down to 291.64. Buyers pulled it back above 293.03, but price still closed below the weekly midline and the 9 EMA at 295.37. Buyers defended the bottom of the map. Sellers still control the higher ground. ⚔️ Daily Battlefield • Friday High: 296.13 • Friday Low: 291.64 • Friday Range: $4.49 • Friday Midline: 293.89 • Daily Bias: Neutral to Bearish Friday opened at 292.03, swept the weekly low, rallied to 296.13, then closed at 294.04. That was a two-sided liquidity day. Bears trapped buyers near 296.13, while buyers trapped late puts near 291.64. 🌵 Desert • Chop Zone: 293.03–294.60 Inside this zone: • Expect fake breakouts. • Expect VWAP battles. • Expect fast reversals. • Expect both sides to hunt liquidity. The middle is where retail gets chopped up. Hunters wait near the edges. 💧 Watering Hole • Decision Level: 294.60 Above 294.60: • Buyers can attack 295.37. • Reclaiming 295.37 opens 296.13. • Holding above 296.13 opens 297.81. Below 294.60: • Sellers can push toward 293.03. • Losing 293.03 opens 292.36. • Breaking 291.64 makes the blood real. 🦶 Footprints • Buyers defended 291.64 after the opening flush. • Sellers rejected 296.13. • Price closed near the $4.49 daily midline at 293.89. • 293.03 remained an important institutional decision level. • 294.60 acted as resistance into the close. • The 9 EMA at 295.37 remains above price. 🧬 Day Personality | Monday • Typical Role: Builds the map for the week. • Continuation Day? Possible if Friday’s weakness holds below 294.60. • Reversal Day? Possible if 291.64 is swept and reclaimed. • Expansion Day? Moderate after Friday’s $4.49 range. • Trend Day? Confirmation required. • Trap Day? High during the opening move. • Best Time: 9:45–10:30 AM.
0
0
Jul 16 •
IWM daily game plan
🦁 IWM GAME PLAN | THURSDAY , JULY 16 📖 THE MAP (Weekly) Weekly High: 302.72 Weekly Low: 290.68 Weekly Range: $12.04 Last week sellers defended the weekly highs, but buyers are attempting to reclaim value. Price is sitting almost exactly in the middle of the weekly range, meaning today’s move could determine whether we revisit the highs or continue toward the weekly lows. ⚔️ THE BATTLEFIELD (Daily) Daily High: 297.14 Daily Low: 294.15 Daily Range: $2.99 Wednesday closed as an inside recovery after Tuesday’s selloff. Buyers reclaimed the EMA, but they haven’t proven full control until price clears yesterday’s high. 🌵 THE DESERT (Chop Zone) 294.90 → 295.73 Expect: • Fake breakouts • Whipsaws • EMA battles Let institutions reveal direction. 💧 THE WATERING HOLE 295.48 Above this level, buyers gain momentum. Below this level, sellers regain control. 🟢 CALLS Trigger: 15-minute candle closes above its high, followed by a 5-minute confirmation and a 1-minute retest. Contracts: - 295C - 296C - 297C Targets: - 296.25 - 296.86 - 297.14 - 298.50 🔴 PUTS Trigger: 15-minute candle closes below its low, followed by a 5-minute confirmation and a 1-minute retest. Contracts: - 295P - 294P - 293P Targets: - 294.15 - 293.62 - 292.60 - 290.68 🌦️ MARKET WEATHER Season: Neutral to Bullish Forecast: Morning Consolidation → Possible Expansion Temperature: Moderate Volatility Wind: Momentum Building Visibility: Fair Water: Buyers Testing Control Predator: Institutions Prey: Retail Chasers 🦁 WATERING HOLE SCORE Trend Strength: 6.4/10 Bull Probability: 58% Bear Probability: 42% Trend Day Odds: 60% Reversal Odds: 40% Best Direction: LONG above 295.48 Most Likely Move: Range Expansion Most Dangerous Time: 11:30–1:00 Best Entry Window: 9:45–10:15
0
0
Jul 14 •
IWM daily game plan
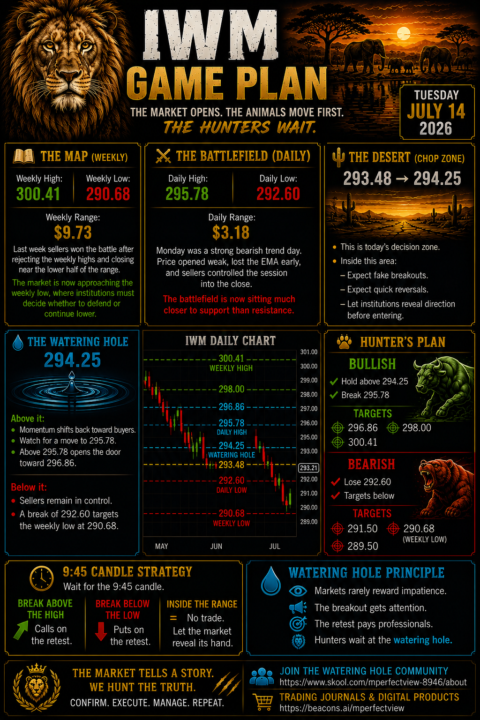
🦁 IWM GAME PLAN | Tuesday, July 14, 2026 📖 THE MAP (Weekly) Weekly High: 300.41 Weekly Low: 290.68 Weekly Range: $9.73 Last week sellers won the battle after rejecting the weekly highs and closing near the lower half of the range. The market is now approaching the weekly low, where institutions must decide whether to defend or continue lower. ⚔️ THE BATTLEFIELD (Daily) Daily High: 295.78 Daily Low: 292.60 Daily Range: $3.18 Monday was a strong bearish trend day. Price opened weak, lost the EMA early, and sellers controlled the session into the close. The battlefield is now sitting much closer to support than resistance. 🌵 THE DESERT (Chop Zone) 293.48 → 294.25 This is today’s decision zone. Inside this area: - Expect fake breakouts. - Expect quick reversals. - Let institutions reveal direction before entering. 💧 THE WATERING HOLE 294.25 This is the first level buyers must reclaim. Above it: - Momentum shifts back toward buyers. - Watch for a move to 295.78. - Above 295.78 opens the door toward 296.86. Below it: - Sellers remain in control. - A break of 292.60 targets the weekly low at 290.68. 🦁 Hunter’s Plan 🟢 Bullish Hold above 294.25 Break 295.78 Targets: - 296.86 - 298.00 - 300.41 🔴 Bearish Lose 292.60 Targets: - 291.50 - 290.68 (Weekly Low) - 289.50 🎯 9:45 Candle Strategy Wait for the 9:45 candle. - Break above the high → Calls on the retest. - Break below the low → Puts on the retest. - Inside the range → No trade. Trade the retest—not the breakout. 🧠 Watering Hole Principle Markets rarely reward impatience. The breakout gets attention. The retest pays professionals. Hunters wait at the watering hole.
0
0
Jul 13 •
IWM Bailey game plan
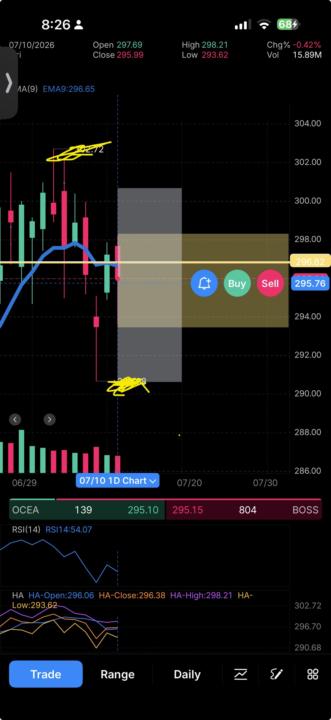
This fits your framework well. Your Weekly Map gives the macro battlefield, and your Daily Battlefield tells you where today’s fight is likely to happen. 🦁 IWM GAME PLAN | Monday, July 13, 2026 📖 THE MAP (Weekly) Weekly High: 300.41 Weekly Low: 290.68 Weekly Range: $9.73 This is a healthy-sized weekly range, which tells us institutions have already shown they’re willing to move the market. The key question now is whether they continue lower or reclaim lost ground. ⚔️ THE BATTLEFIELD (Daily) Daily High: 298.21 Daily Low: 293.62 Daily Range: $4.59 Friday (the last trading session) closed weak after rejecting higher prices. Buyers attempted to defend the EMA but couldn’t hold control into the close. The market is beginning the new week slightly below the middle of last week’s structure. 🌵 THE DESERT (Chop Zone) 295.76 → 296.82 This is your decision zone. Inside this area: - Buyers and sellers are evenly matched. - Expect fake breakouts and whipsaws. - Don’t force trades. This is where patience beats prediction. 💧 THE WATERING HOLE 296.82 This is the first level institutions must reclaim. Above it: - Buyers regain momentum. - Watch for a move toward 297.94. - If 297.94 breaks, 298.21 becomes the next target. Below it: - Sellers remain in control. - 295.76 becomes resistance. - A break of 295.18 opens the door toward the weekly low around 290.68 over time. 🦁 Hunter’s Plan 🟢 Bullish - Hold above 296.82 - Break 297.94 - Target: - 298.21 - 299.50 - 300.41 🔴 Bearish - Lose 295.76 - Reject back below 296.25 - Targets: - 295.18 - 294.50 - 293.62 🎯 9:45 Candle Strategy Wait for the 9:45 candle to close. - Above the high → Calls after the retest. - Below the low → Puts after the retest. - Inside the range → No trade. Let the market reveal its hand. 🧠 Watering Hole Principle Don’t chase the first move. The first move creates emotion. The retest creates opportunity. Hunters don’t attack when the herd starts running—they wait to see where it returns to drink.
0
0
Jul 1 •
IWM Daily Game Plan.
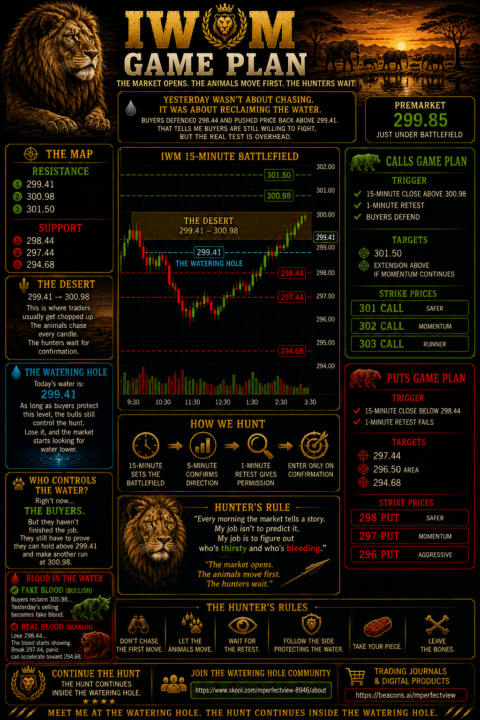
🦁 IWM GAME PLAN 🗺️ THE MAP Yesterday wasn’t about chasing. It was about reclaiming the water. Buyers defended 298.44 and pushed price back above 299.41. That tells me buyers are still willing to fight, but the real test is overhead. The next watering hole is sitting near 300.98–301.50. 🦁 THE BATTLEFIELD Resistance - 299.41 - 300.98 - 301.50 Support - 298.44 - 297.44 - 294.68 🌵 THE DESERT 299.41 → 300.98 This is where traders usually get chopped up. The animals chase every candle. The hunters wait for confirmation. 💧 THE WATERING HOLE Today’s water is: 299.41 As long as buyers protect this level, the bulls still control the hunt. Lose it, and the market starts looking for water lower. 👀 WHO CONTROLS THE WATER? Right now… The buyers. But they haven’t finished the job. They still have to prove they can hold above 299.41 and make another run at 300.98. 🩸 BLOOD IN THE WATER If price loses 298.44… The blood starts showing. If sellers break 297.44, panic can accelerate toward 294.68. If buyers reclaim 300.98… Yesterday’s selling becomes fake blood. ⚔️ THE WEAPONS 🟢 Calls Trigger - 15-minute close above 300.98 - 1-minute retest - Buyers defend Targets - 301.50 - Extension above if momentum continues Strike Prices - 301 Call - 302 Call - 303 Call (runner) 🔴 Puts Trigger - 15-minute close below 298.44 - 1-minute retest fails Targets - 297.44 - 296.50 area - 294.68 Strike Prices - 298 Put - 297 Put - 296 Put 🦁 HUNTER’S RULE “Every morning the market tells a story. My job isn’t to predict it. My job is to figure out who’s thirsty and who’s bleeding.” “The market opens. The animals move first. The hunters wait.” 📚 CONTINUE THE HUNT 🦁 Join the Watering Hole Community https://www.skool.com/mperfectview-8946/about 🛒 Trading Journals & Digital Products https://beacons.ai/mperfectview Meet me at the Watering Hole. The hunt continues inside the Watering Hole.
0
0
1-22 of 22
powered by

skool.com/mperfectview-8946
A structured space for traders and creators to understand liquidity, structure, traps, and discipline without drowning in noise.
Suggested communities
Powered by