

2d •
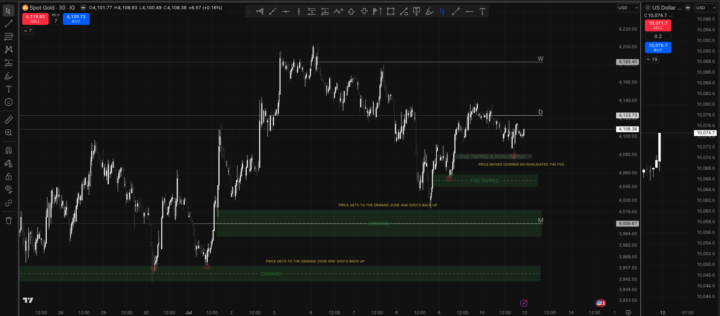
SUPPLY & DEMAND
The chart shows two demand zones where price found strong buying interest and reacted sharply upward. The first bullish FVG was tapped and produced the expected bullish reaction. The second FVG was later invalidated after price traded and closed below its lower boundary.
2d •
Position Sizing
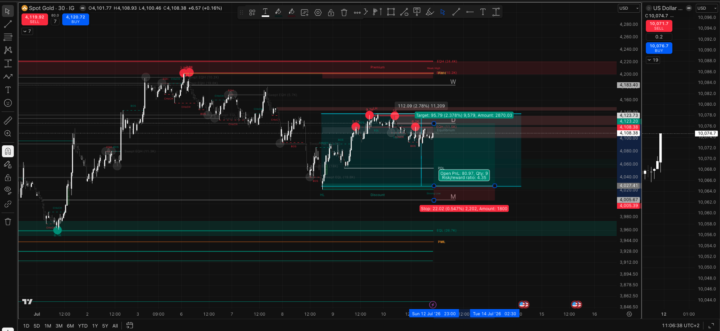
The planned entry is around 4,027.41, with the stop-loss placed near 4,005.39. This creates a total risk distance of approximately 22.02 points. Based on the amount I am prepared to risk on the trade, the position size is set to 9 contracts. The take-profit is positioned around 4,123.20, giving a potential reward of approximately 95.79 points. This produces a risk-to-reward ratio of roughly 1:4.35. In simple terms, I am risking about 22 points to potentially make almost 96 points. The stop-loss is placed below the strong low and the lower boundary of the range, where the bullish setup would be considered invalidated.
2d •
Ranges
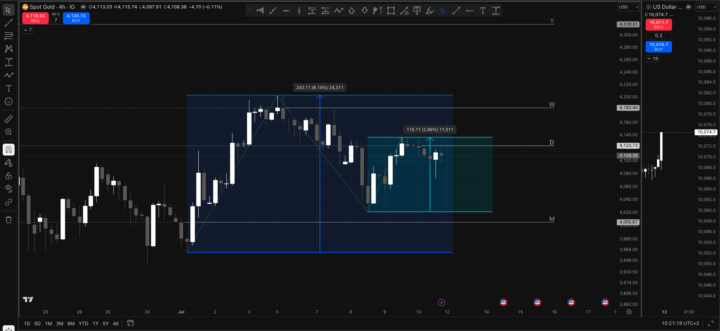
In the attached images, you can see the market structure across the 4H, 1H, and 30M timeframes, along with two clearly defined price ranges. I started with the 4H chart to identify the broader market structure. From there, I moved down to the 1H timeframe to refine the levels, and then made further adjustments on the 30M chart for a more detailed view. To be honest, I’m still not fully confident about how to apply the models, as I haven’t gone through that lesson yet. But based on my current understanding, I would assume that when price reaches the high of the range, we begin looking for short opportunities, and when price reaches the low of the range, we look for potential long setups. Of course, I would still wait for confirmation rather than entering purely because price touched either side of the range. At the high - A liquidity sweep above the high - Strong rejection - Bearish CHoCH or MSS on a lower timeframe - Bearish displacement and possibly an FVG retest At the low, look for the opposite: - A sweep below the low - Bullish rejection - Bullish CHoCH or MSS - Bullish displacement and a retracement entry
2d •
Market Structure Screenshot
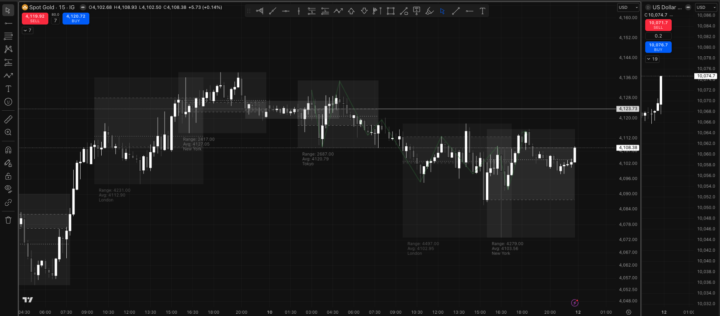
In the screenshot we have a downtrend, we can notice a fake breakout and an actually breakout of the trendline. We can expect from this point to continue up the the daily point.
1-4 of 4
powered by

skool.com/modern-wyckoff-2223
Wyckoff is a time-tested method for analyzing financial markets developed by Richard D. Wyckoff in the 1920's. We made it simple. Live trading NY open
Suggested communities
Powered by