
Write something

Nov '25 •
The quiet
Sorry I've been gone for a few days, those of you tapping in each day. I've been trading, but not posting. I'll get back to it. I did do a live the other day, analyzing a number of stocks. This weekend I'll do it again. Some potential bargains out there. Stay tuned:) to God be the glory
0
0
Nov '25 •
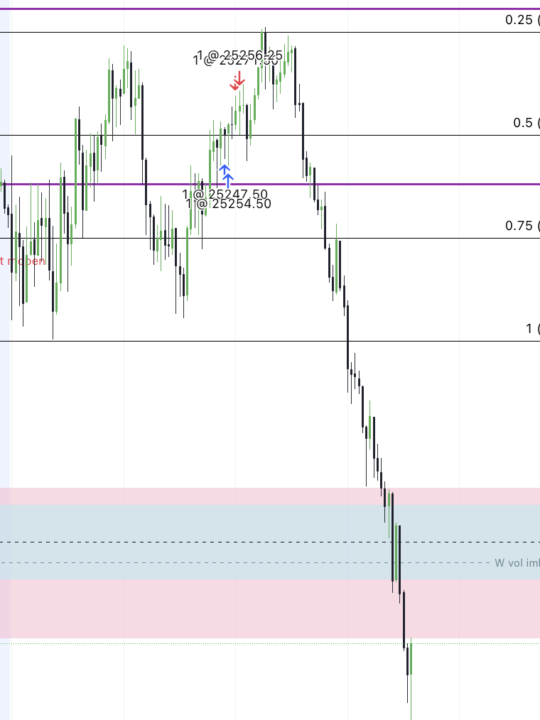
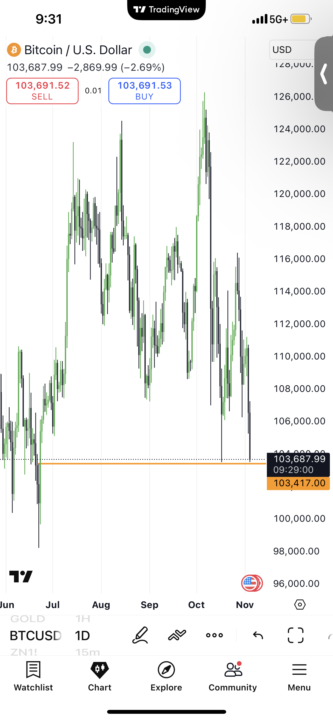
Manipulation definition
Words don't describe. Run up to end the day yesterday. NVDA pump after hours. Jobs data pump pre market. Support defined. Buyers drawn in. Then..destruction
0
0
Nov '25 •
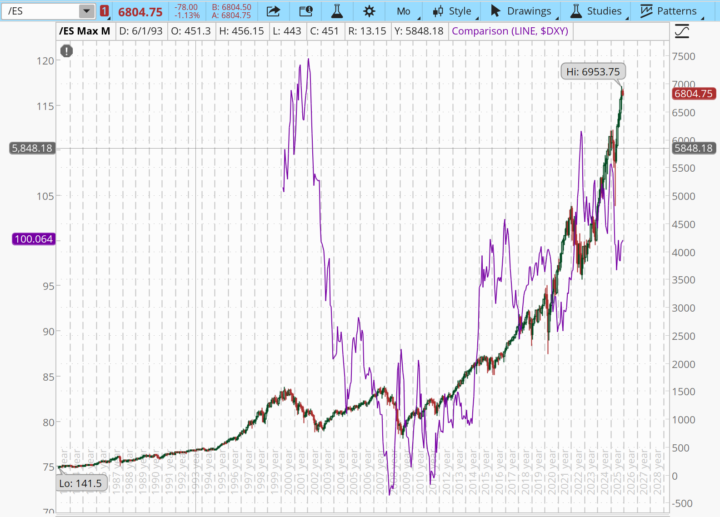
Why Should Anyone Invest
The purple line represents the $DXY, a dollar index (representing the value of our money), and the red/green line represents the S&P 500 futures (broad measure of the stock market). One is parabolic, 1983 at $141.50 up to a high in 2025 at $6953.75, that's 4800% increase. Cash savings in that same time 2000 at $121.02, and currently at 100.05. 17% decrease. We invest to protect the value of of money. Money we earned by trading time. We invest to protect our time.
4
0
1-12 of 12
powered by

skool.com/lifestyle-investments-7649
A community for regular people who want to utilize the power of investing to improve their life and the lives of their families in the future.
Suggested communities
Powered by