
Write something

Feb 3 •
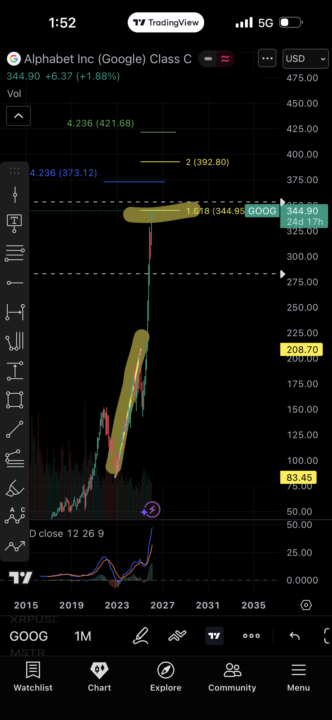
$GOOG
MACD is pushing into oversold territory while price is currently tagging the 1.618 measured move from the highlighted yellow range on the higher timeframe. This area often acts as a potential exhaustion zone, where we look for signs of a corrective leg or change in structure rather than continuation. In the second chart (shorter timeframe), you can see a confluence stack between the 1.50 and 1.618 extensions from the most recent minor retrace — reinforcing this level as a decision zone across multiple timeframes. Bias: Neutral-to-cautious here — waiting for confirmation before positioning. #GOOG #Fibonacci #MarketStructure #MACD #Confluence #TechnicalAnalysis
0
0
Feb 3 •
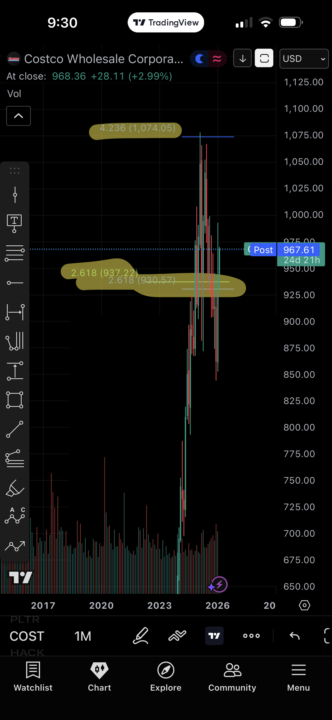
$COST
I genuinely find Fibonacci analysis fascinating. Text book retrace from the 4.236 extension. SP enveloped around the 2.618 extensions.
0
0
Feb 2 •
$HACK.ax
Is about due for a good correction, Confluence stacks around $10.70. It’s about time.
0
0

Feb 1 •
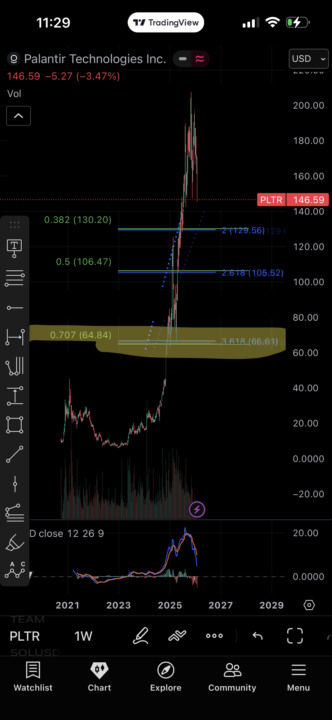
$PLTR
Coming off the heat. Price deviating from the parabolic leg with a potential deep retracement lining up with the brief change of structure inside the sticky bull run. Short–mid term target mapped near $65 — where Fib confluence and prior structure stack as a high-probability magnet
0
0
Jan 31 •
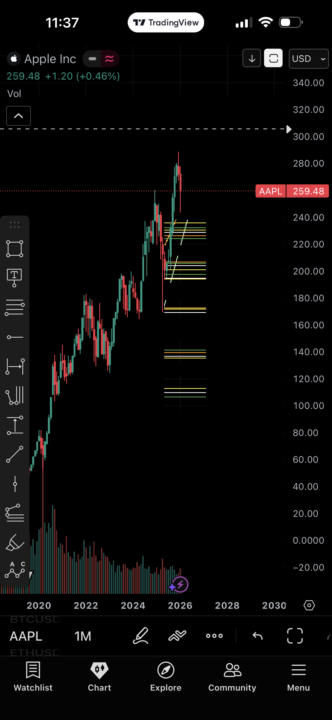
$AAPL
$AAPL | Monthly Multiple points of interest on this chart, but it’s a tough one to apply fibs for medium–long term probability. Apple’s trend has been relentless. I always say — what goes up must come down… yet AAPL has never meaningfully reversed extension beyond its most recent major low. These stacking zones show deviation, not clean confluence. Does this finally become the cycle where the extension actually unwinds? 👀 #AAPL #Stocks #TechnicalAnalysis #Fibonacci #Markets
0
0
1-22 of 22
powered by

skool.com/fibonacci-confluence-academy-7075
Learn Fibonacci properly - price structure, time confluence, and risk math - so you can trade independently with confidence
Suggested communities
Powered by