Identity-Led Content System™
Private
117 members
$197

Create stronger content, attract aligned followers, build trust, and turn visibility into clients, sales, and opportunities.
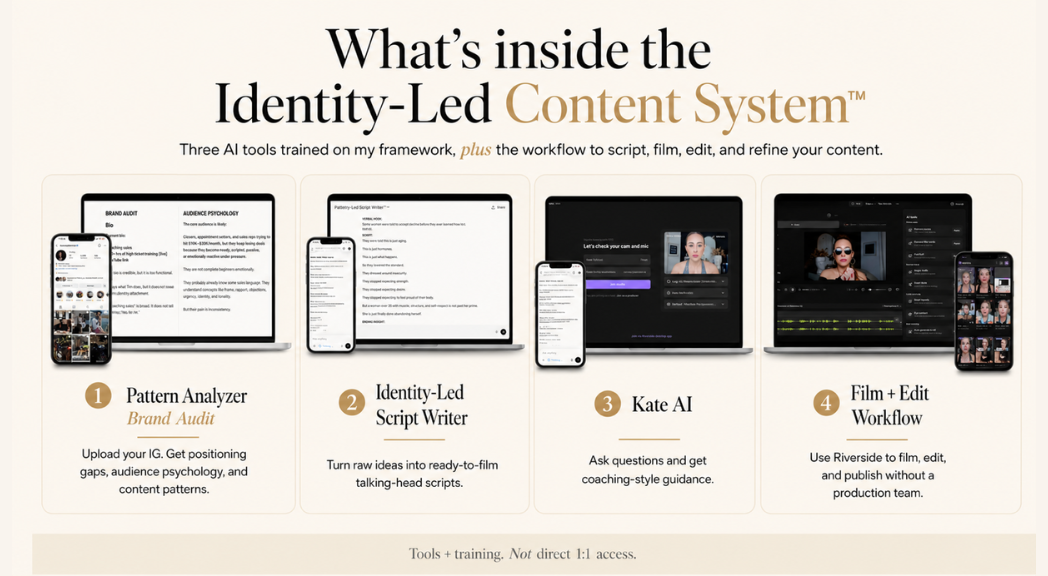
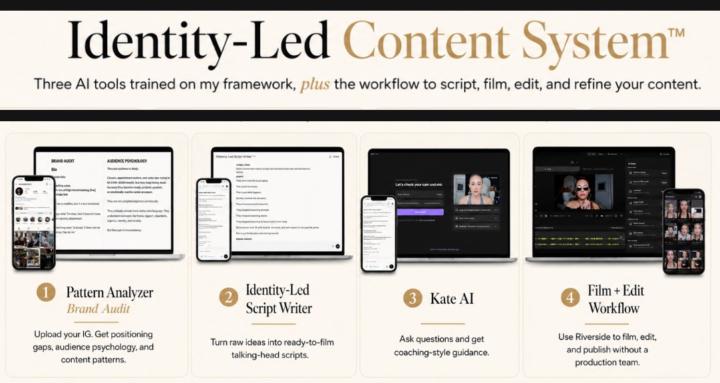
The Identity-Led Content System™ helps you stop guessing what to post and start creating talking-head content that feels clear, specific, and emotionally resonant.
Inside, you’ll get:
⚡️ Identity Pattern Analyzer AI → a custom brand audit and positioning tool that analyzes your profile, audience psychology, and content opportunities
⚡️ Identity-Led Script Writer AI → a custom script tool that turns your ideas into ready-to-film talking-head content
⚡️ Kate AI → Kate’s custom AI coach for messaging, content direction, and strategy
⚡️ Kate’s Riverside filming + editing process for creating polished content yourself
⚡️ Annual Content Growth Workbook → the printable system Kate uses to physically plan, track, and study content performance so you stop guessing and start creating from real patterns in your own data
One-time payment: $197 for lifetime access.
skool.com/createwithkate
The methodology that changes how your content feels. Scripts, brand audit, bio rewrite, and positioning that actually converts.
Powered by