Activity
Mon
Wed
Fri
Sun
Jul
Aug
Sep
Oct
Nov
Dec
Jan
Feb
Mar
Apr
May
What is this?
Less
More
Memberships
Prime Tech Academy USA
263 members • Free
5 contributions to Prime Tech Academy USA

12d •
Task 3
بناءً على البيانات المتوفرة في الملف المرفق لمشروع الإشراف في المدينة المنورة (سعود كونسلت)، قمت بتحليل أداء الصحة والسلامة والبيئة (HSE) من خلال مؤشرات التنفيذ ونسب الإنجاز لكل مقاول، حيث يعكس "اكتمال العمل" جانباً حيوياً من الامتثال التشغيلي. لقد قمت بتصميم **لوحة بيانات تفاعلية (Interactive Dashboard)** احترافية باستخدام لغة HTML و CSS و JavaScript (Chart.js) لتظهر إحصائيات المقاولين وحالات أوامر العمل. ### كود لوحة البيانات (HSE Dashboard) يمكنك نسخ الكود التالي وحفظه بصيغة .html وتشغيله في أي متصفح: ```html <!DOCTYPE html> <html lang="ar" dir="rtl"> <head> <meta charset="UTF-8"> <title>لوحة مؤشرات الأداء HSE - مشروع المدينة المنورة</title> <script src="https://cdn.jsdelivr.net/npm/chart.js"></script> <style> body { font-family: 'Segoe UI', Tahoma, Geneva, Verdana, sans-serif; background-color: #f4f7f6; margin: 0; padding: 20px; } .container { max-width: 1200px; margin: auto; } .header { background: #2c3e50; color: white; padding: 20px; border-radius: 10px; text-align: center; margin-bottom: 20px; } .stats-grid { display: grid; grid-template-columns: repeat(auto-fit, minmax(200px, 1fr)); gap: 20px; margin-bottom: 20px; } .stat-card { background: white; padding: 20px; border-radius: 10px; box-shadow: 0 4px 6px rgba(0,0,0,0.1); text-align: center; } .stat-card h3 { margin: 0; color: #7f8c8d; font-size: 0.9em; } .stat-card p { margin: 10px 0 0; font-size: 1.8em; font-weight: bold; color: #2c3e50; } .charts-grid { display: grid; grid-template-columns: 1fr 1fr; gap: 20px; } .chart-container { background: white; padding: 20px; border-radius: 10px; box-shadow: 0 4px 6px rgba(0,0,0,0.1); } .footer { text-align: center; margin-top: 30px; color: #95a5a6; font-size: 0.8em; } </style> </head> <body> <div class="container"> <div class="header"> <h1>لوحة مؤشرات أداء المقاولين (HSE & Operations)</h1> <p>مشروع الإشراف على مقاولى أعمال العقد الموحد - سعود كونسلت</p> </div> <div class="stats-grid"> <div class="stat-card">
0 likes • 11d
تمام اسوي تاني
0 likes • 5d
[attachments]
10d •
Task 4
https://notebooklm.google .com/notebook/7aa3e22d -766f-4650-98dc-0e2fe371acfd ?authuser=1
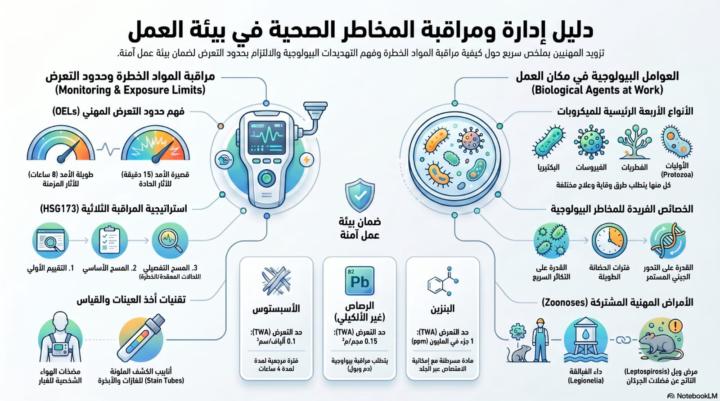
0 likes • 5d
https://gamma.app/signin?redirect_to=https%3A%2F%2Fgamma.app%2Fdocs%2FUntitled-mr4hwfrxddbnnjz
0 likes • 5d
[attachment]
6d •
Task 5
Join this project https://lovable.dev/projects/1ebc4265-11d6-4ab6-b6fa-64041d626b74?magic_link=mc_55cfeaa3-bb9b-4294-a490-667e2b10812b
0
0
12d •
Task 2
Part 1 عند توجه الفرقة الميدانية لتنفيذ أعمال على محطة توزيع جهد منخفض (LV) وأثناء فتح باب المحطة يهدف إجراء أعمال ربط للكابل ( Termination) حدت وميض كهربائي (Arc Flash)، مما أسفر عن تعرض ) فنيين للمقاول بحروق . عدم المام المستلم والاستشاري بمخاطر التعامل مع محطات LV التقيد باجراءات العمل الامن عمل الام ضعف إعد مدراك مخاطر القوس الكهربائي لدى الفنيين يجب رفع الوعي بمخاطر التعامل مع محطات الجهد المنخفض عدم البدء في اعمال الجهد المنخفض قبل عمل TBT ضرورة تطبيق مبدأ فصل - تحقق - ارضي - ثم أعمل عدم فتح أي لوحه الا بعد التأكد 100% من فصل التغذية التعامل مع جميع الدوائر على انها حية حتى يثبت العكس الالتزام بالوضعية الصحيحة عند فتح أبواب الخلايا واللوحات Part 2 بناءً على التقرير المرفق، يتبين حدوث حادث وميض كهربائي (Arc Flash) أثناء فتح باب محطة توزيع جهد منخفض (LV) لأعمال ربط الكابلات، مما أسفر عن إصابة فنيين بحروق نتيجة لعدة قصور في إجراءات السلامة والوعي بالمخاطر.فيما يلي تحليل للحادث وتوصيات للدروس المستفادة (Lessons Learned):أولاً: أسباب الحادث (Root Causes)ضعف إدراك المخاطر: عدم إدراك الفنيين لمخاطر القوس الكهربائي (Arc Flash) في محطات الجهد المنخفض [2].عدم الالتزام بالإجراءات: عدم التقيد التام بإجراءات العمل الآمن (Safe Work Procedures) [2].قصور في إعداد مستندات السلامة: ضعف إعداد وتحليل مخاطر العمل (Risk Assessment) قبل البدء [2].نقص الكفاءة: عدم إلمام المستلم والاستشاري بمخاطر التعامل مع محطات الـ LV [2].ثانياً: الإجراءات التصحيحية والتوصيات (Lessons Learned)لتفادي تكرار مثل هذه الحوادث، يجب تطبيق التالي بصرامة:التوعية والتدريب: رفع الوعي بمخاطر التعامل مع محطات الجهد المنخفض ومخاطر القوس الكهربائي [2].اجتماع ما قبل العمل (TBT): عدم البدء في أي أعمال جهد منخفض قبل عمل اجتماع صندوق الأدوات (Toolbox Talk) لشرح المخاطر [2].تطبيق المبدأ الذهبي للسلامة: تطبيق قاعدة (فصل - تحقق - أرضي - ثم اعمل) [2].التأكد من العزل: عدم فتح أي لوحة أو خلية إلا بعد التأكد 100% من فصل التغذية الكهربائية [2].قاعدة "العمل بحذر": التعامل مع جميع الدوائر على أنها حية (مكهربة) حتى يثبت العكس [2].الوضعية الآمنة: الالتزام بالوضعية الصحيحة والوقوف الجانبي عند فتح أبواب الخلايا واللوحات لتجنب الإصابة المباشرة في حال حدوث وميض [2].خلاصة: السلامة الكهربائية لا تتجزأ، والتعامل مع الجهد المنخفض (LV) يحمل مخاطر جسيمة لا تقل عن الجهد العالي.
16d •
Task 1
Task1: AI-Based Hazard Identification Objective: **Use AI tools to identify unsafe acts and unsafe conditions.* *Part 1: Video (using Google Gemini – Gemini Live)* Record a 30–45 second video showing an unsafe act or unsafe condition. Use Gemini Live during the video and ask: “What hazards do you see?” Briefly say if you agree with the AI or not. *Part 2: Image Analysis (using Google Lens)* Choose one unsafe work image. Analyze it using Google Lens, then write: 2 hazards you identified 1 control measure for each Submission: 1 short video 1 image + short written analysis (max 5 lines)

0 likes • 12d
اسويه تاني👍👍
1-5 of 5