Activity
Mon
Wed
Fri
Sun
Jul
Aug
Sep
Oct
Nov
Dec
Jan
Feb
Mar
Apr
May
Jun
What is this?
Less
More
Memberships
Sarmaaya Skool
3.3k members • Free
Trading Fanatics
10.7k members • Free
5 contributions to Sarmaaya Skool

6d •
Intraday feed
Hi Sarmaaya People, You guys are working on the digital end I have a question. Is there any data provider who is providing the intraday data using REST interface including 4h, 1h, 30m, 15m, 5m... Thanks in advance
0 likes • 12h
@Laeeq Ahmad thora yaha bhe reply karde thanks in advanced
0 likes • 12h
@Laeeq Ahmad I tried they dont have intraday .... I need to aggregate for H1 and H4 Candles

5d •
DCR
DCR (Daily Chart) DCR has repeatedly shown a pattern of printing a new Higher High (HH), followed by a period of consolidation, The current structure is similar, with price consolidating after its latest HH while maintaining a Higher Low (HL) above the trendline.This healthy consolidation suggests accumulation rather than weakness, keeping the bullish market structure intact.A breakout above the consolidation range could open the door for the next HH in the ongoing uptrend.

1 like • 2d
@Kamran Chaudhry Yes I will consider anything above 37.3 and hold bullish
1 like • 2d
@Kamran Chaudhry this one takes time but for you only I hardly do these charts any more.....
5d •
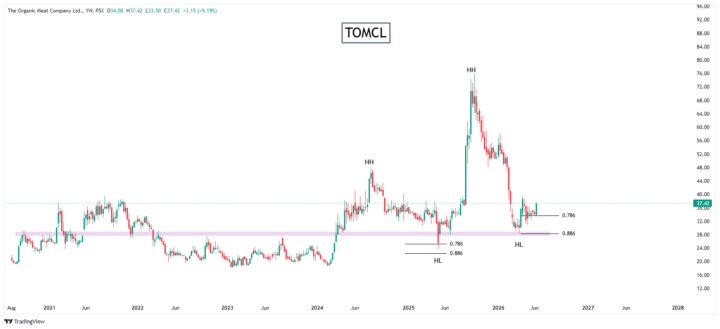
TOMCL
TOMCL is showing multiple bullish confluences: a completed Bullish Bat pattern, strong RSI bullish divergence, and a steady recovery from the major 0.786–0.886 Fibonacci support zone. A decisive breakout above the 37–38 resistance area can confirm trend continuation and open the door toward the 45–48 zone. As long as the trendline and recent higher low remain intact, the bullish structure stays valid. 📈
0 likes • 4d
Entered at green dot

6d •
WAVESAPP
(WAVESAPP) showing a strong accumulation breakout on the daily timeframe! After months of consolidation, price has pushed above the accumulation range with a notable increase in volume, signaling renewed buying interest. The breakout aligns with the projected range target and could mark the beginning of a new bullish phase. 🎯 Watch for price to hold above the breakout zone as support for further upside momentum.
0 likes • 6d
[attachment]
6d •
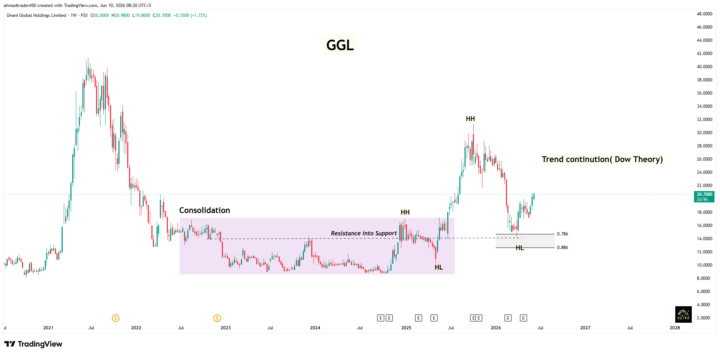
GGL
GGL (Weekly Chart) Analysis After a long consolidation phase, GGL successfully converted a major resistance zone into support and formed a clear Higher Low (HL) → Higher High (HH) structure, signaling a trend reversal. The recent correction found support around the 0.786–0.886 Fibonacci retracement zone, where buyers stepped in again. Price is now recovering and attempting to continue the uptrend. As long as the higher low remains intact, the chart structure favors trend continuation under Dow Theory, with the previous higher high remaining a key area to watch.
0 likes • 6d
[attachment]
1-5 of 5

Active 12h ago
Joined May 3, 2026
Powered by