Activity
Mon
Wed
Fri
Sun
Aug
Sep
Oct
Nov
Dec
Jan
Feb
Mar
Apr
May
Jun
Jul
What is this?
Less
More
Memberships
Ivy League Free Course
5.2k members • Free
8 contributions to Ivy League Free Course

Feb 25 •
NEW INNER CIRCLE MEMBER
Let's all celebrate with @Dalisa Mena 👏 She just joined the 1-on-1 coaching program and is taking those next steps towards success with Amazon!

1 like • Feb 25
Congrats Dalisa 🙌🏻🙌🏻
Feb 10 •
ATTENTION EVERYONE! 🚨
This just changed the game for beginners! If you’ve already used my free ungate list, this is the next move. You can now get AUTO-UNGATED for THOUSANDS of products using this tool. I made a quick tutorial you can follow along with! USE THE TOOL HERE – https://boxem.com?ref=mgvhnji

0 likes • Feb 25
@Linda Michael Thank you! So far so good and you have a good day as well 🙂
0 likes • Feb 25
@Alain Leon Hi still exploring and waiting to see if I got approved from Amazon Seller.
Feb 24 •
NEW INNER CIRCLE MEMBER
Let's all congratulate @Toya Coleman for joining into the 1-on-1 coaching program! This is how you level up! Let's get to work 👏
0 likes • Feb 24
Congrats to Toya 🎉
Feb 23 •
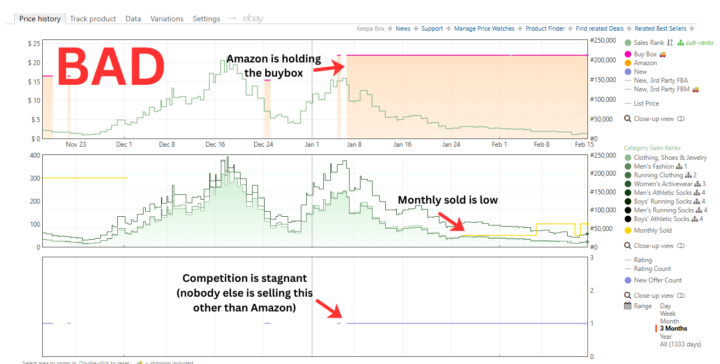
LEARN THIS BEFORE YOU BUY!
Most beginners only look at price. That’s how you end up stuck with inventory! Learn to read the Keepa charts to make data-backed decisions 💪 One Keepa chart is BAD: Amazon holding buy box Low monthly sold No real seller activity One chart is GOOD: Price is steady 2k+ monthly sold Competition is rotating This is the difference between momentum and dead inventory. Learn to read this before you spend a dollar!
2 likes • Feb 23
Thanks 😊
Feb 19 •
NEW INNER CIRCLE MEMBER
Everyone congratulate @Cinthia Diaz for joining into the 1-on-1 coaching program and taking action towards her goals. She’s gonna do great! 💪
3 likes • Feb 19
Congrats Cynthia!!
1-8 of 8

Active 127d ago
Joined Feb 7, 2026
Powered by