Activity
Mon
Wed
Fri
Sun
Aug
Sep
Oct
Nov
Dec
Jan
Feb
Mar
Apr
May
Jun
What is this?
Less
More
Owned by Options
STOP trading market direction. Start using options strategies to turn volatility into steady income. We sell premium, and think in probabilities.
Memberships
AI Options Trading Lab
17 members • Free
Options Made Simple Webinar
1.4k members • Free
Options Auto Trader
523 members • Free
Trading 101: Stock Options
99 members • Free
Options Trader Network
8 members • $97/month
Options Formula
22 members • Free
TRADING MADE SIMPLE by Ali
1k members • Free
OptionMasters
27 members • Free
Option4All
59 members • Free
6 contributions to OptionMasters

13d •
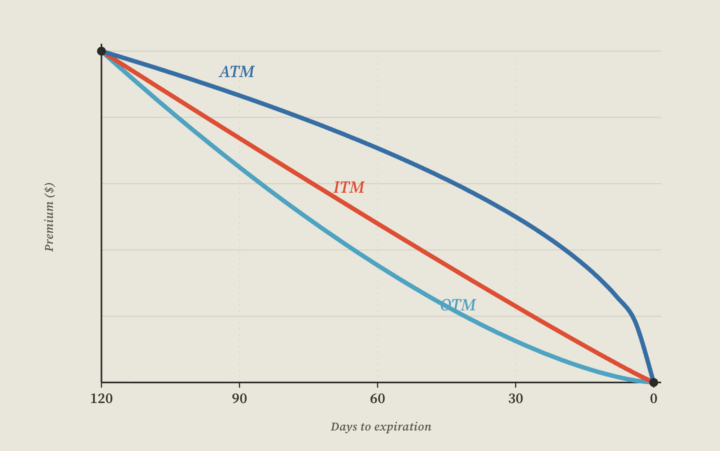
The "linear" theta line is a lie
I ran every strike through Black-Scholes this weekend. The output surprised me ($100 underlying, 20% IV, 4% rates): - ATM theta at 30 DTE: $4.36/day per contract - ATM theta at 1 DTE: $21.43/day per contract ATM decay accelerates into expiration. But OTM does the opposite. 5% OTM theta peaks at 21 DTE, then collapses, 10% OTM theta is essentially gone by 14 DTE. The closer you get to expiration, the slower OTM premium decays. The reason is gamma. Theta doesn't have its own engine. It borrows gamma's. Near expiration, gamma concentrates almost entirely at the money. OTM strikes lose gamma, so they lose theta too. Your OTM short that feels safe at 21 DTE has already peaked. Holding it to expiration isn't collecting more decay. It's carrying pennies in front of a steamroller. Theta is not magic income. It is rent for sitting on gamma risk.
1
0
Apr 2 •
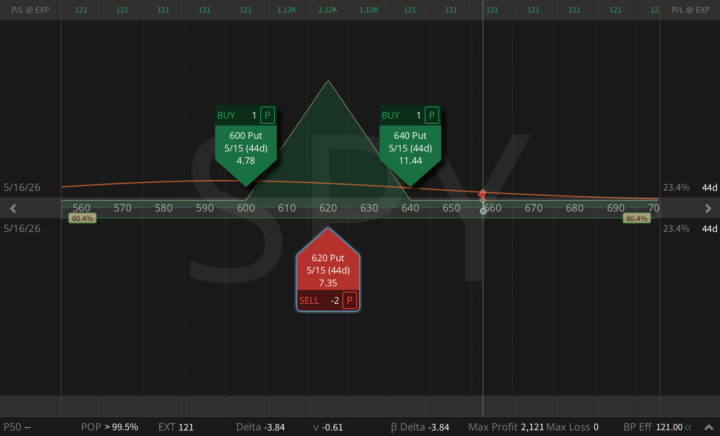
SPY Risk-Free Butterfly
Hi, I did it again! If you follow, on March 23 I opened a SPY 640/620 put ratio spread for a $598 credit. Yesterday, I bought the 600 put for $4.77 and turned the entire position into a RISK-FREE butterfly. Now the trade has: - No downside risk - No upside risk - Locked-in profit: $121 - Max profit: $2,121 This is how short volatility works when we stop thinking directionally and start thinking in structures.
1 like • Apr 5
@Sebastian Alonso I'll record on YouTube soon.
Mar 11 •
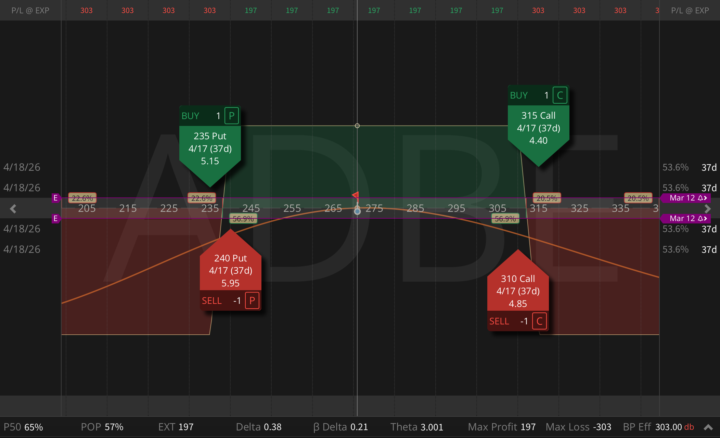
7 of 30 Real Trade Ideas from Our Fund
As you know, when I present trade ideas here, I usually go very deep into the analysis. Each position is built on multiple layers of research: fundamentals, implied volatility levels, volatility surface (both skew and term structure), liquidity, and additional signals I track and I'll share in the posts here. The goal is always to identify trades with strong premium, high probability, and structures that are relatively easy to manage. But today I decided to do something a little different. After our latest fund portfolio meeting and internal discussion, we opened 30 new trades across the portfolio. Instead of writing a long analysis for each one, I will simply show you 7 of those trades exactly as they were placed. Below are 7 of the 30 new positions currently running in our portfolio. 1. ADBE Iron Condor Structure: Buy 235P / Sell 240P / Sell 310C / Buy 315C (37 DTE) Premium collected: $197; POP: 57%; P50 probability: 65%; Beta-weighted delta: +0.21; Theta: +$3/day; Max profit: $197; Max loss: $303 2. COIN Iron Condor Structure: Buy 130P / Sell 140P / Sell 240C / Buy 250C (65 DTE) Premium collected: $350; POP: 61%; P50 probability: 74%; Beta-weighted delta: -1.61; Theta: +$3.28/day; Max profit: $350; Max loss: $650 3. CRM Put Ratio Spread Structure: Buy 185P / Sell 2x175P (37 DTE) Credit received: $117; POP: 86%; Beta-weighted delta: +3.91; Theta: +$9.73; Max profit: $1,117 4. NKE Naked Put Structure: Sell 50P (65 DTE) Premium collected: $152; POP: 75%; P50 probability: 86%; Beta-weighted delta: +2.22; Theta: +$2.47; Max profit: $152 5. PEP Strangle Structure: Sell 145P / Sell 170C (37 DTE) Premium collected: $279; POP: 71%; P50 probability: 83%; Beta-weighted delta: -0.69; Theta: +$9.70; Max profit: $279 6. AMD Put Credit Spread Structure: Buy 180P / Sell 190P (37 DTE) Premium collected: $262; POP: 66%; P50 probability: 78%; Beta-weighted delta: +5.37; Theta: +$2.03; Max profit: $262 7. VISA Risk-Free Butterfly (Synthetic Bonds with Lottery Ticket)
2
0
Feb 25 •
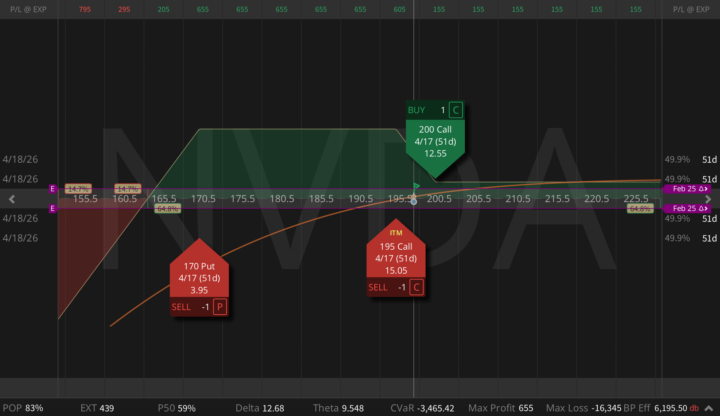
The Highest-Probability Way to Trade NVDA Earnings Tonight?
NVDA reports after the bell tonight, and this is the single most important event of the week for the entire technology complex, for AI capex sentiment, and potentially for sector rotation across the market! If NVDA re-prices the AI narrative, QQQ moves, growth vs value rotation shifts, even energy and cyclicals feel it through flows. Now here’s what’s interesting. Consensus is extreme: 65-66B revenue, +66% YoY. EPS up 70%, Data Center nearly the whole engine. The base case is already beat and strong guide. You'd expect options to price this like a bomb, but they aren't! The at-the-money straddle implies roughly a 5-6% move. Over the last 12 quarters, the average implied move was closer to 7.5%. By NVDA's own standards, this event is being priced smaller than usual. That's the first non-obvious signal. The second one is even more important. Historically, NVDA's implied earnings move trades at about 1.5x the tech sector (XLK). This quarter, that ratio is closer to 0.9x. Read that again: the market is pricing NVDA as less idiosyncratic than the sector, at a moment when AI capex concentration arguably makes it more idiosyncratic than ever. Yes, front-week IV is high (72% vs 55% baseline). Yes, there will likely be IV crush. But the lazy trade "short the rich IV" assumes the event premium itself is bloated. This time, the event premium is compressed relative to history and relative to tech. That changes the game, so we're not putting on calendar spreads today. The edge, in my view, sits in: - NVDA vs sector variance - Defined-risk or asymmetric volatility harvesting The market is not overpricing fear, it's compressing NVDA's uniqueness into sector volatility, and if that assumption breaks tonight, the move won't care about your straddle math. Because the event move is priced relatively small (5-6%) and the front-week premium is not unusually fat versus history, forcing a weekly Jade Lizard would mean selling compressed event variance with thin margin for error. So instead of playing the binary print, we step out to April (51 DTE) and build a safer Earnings Jade Lizard.
3
0
Feb 18 •
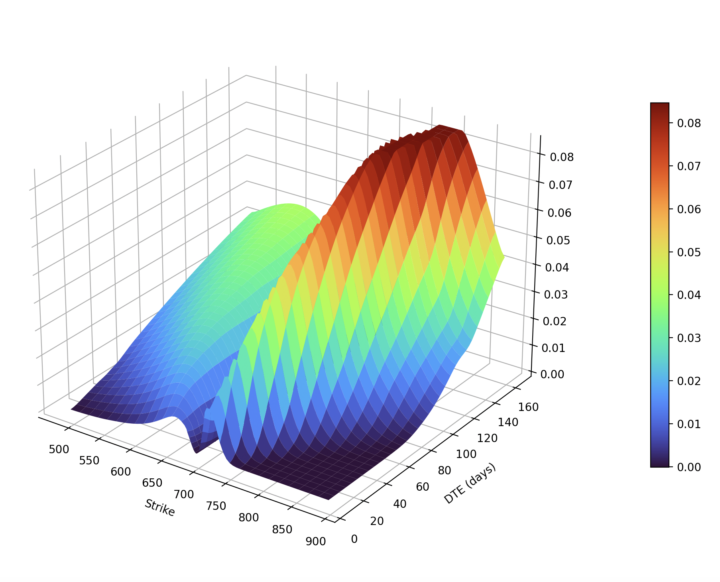
Your "safe" short strangles just lost 2x more than your stress test predicted?
Hi, I just finished modeling the SPY Volga surface into the close (see attached). Now imagine this: you sold the OTM strangles, you stress-tested a 5-point volatility move, looked at the potential drawdown, and you accepted it. Then the spike actually hit, and you lost double. Why? Because your platform lied to you! Most retail brokers show you a static snapshot of your exposure RIGHT NOW. They don't show you what happens to that exposure when IV moves from 15 to 25. The reality is Vega isn't a constant. When volatility rips, the entire surface reprices, your short Vega becomes significantly more negative exactly when you need it to shrink. That's Volga (also known as Vomma). Think about it: if Delta has Gamma, Vega has Volga. It's the second-order Greek that measures how your Vega changes as volatility moves. If you're short the wings, you are Short Volga. My rule: don't size off today's Vega. Ask: What is my Vega if IV jumps 20-30 points? If you haven't modeled that, you don't know your true position size!
3
0
1-6 of 6
