Activity
Mon
Wed
Fri
Sun
Feb
Mar
Apr
May
Jun
Jul
Aug
Sep
Oct
Nov
Dec
What is this?
Less
More
Memberships
FasterFreedom RE Launch
1.2k members • Free
Midas Touch 🧨 Roadmap
12.6k members • Free
InvestCEO with Kyle Henris
38.9k members • Free
ADHD Entrepreneurs
6.7k members • $49
Selling Online / Prime Mover
33.9k members • Free
6 contributions to InvestCEO with Kyle Henris

Apr 7 •
InvestCEO TradeLog "Rate of Return" calulation needed
Perhaps Kyle's trade log didn't have this formula or I deleted somehow, but my column AA "Rate of Return" does not have a calulcation in the field. This calculation would need to factor in if the trade is a long or short position, AND the number of contracts, AND if you scaled out of the position with orders in the Close #2 and Close #3 columns. I am sure if i sat down and thought hard enough I could figure it out, but I was hoping someone here already had that Rate of Return calculation mastered in their own sheet. If so, please share.
1 like • Apr 7
I think I was making it more complicated than it needed to be as the formula can draw on data in the spreadsheet that already computed what I was looing for. I am using this: =IFERROR((Z8/(I8*J8)),"") and it seems to be working for me.
0 likes • Apr 7
@Kylie Hutchinson What do you have for your formula in the Profit(Loss) field? AF12 in my screen shot, and the AJ columns/Avg/Contract and the Average fields in AM column?
Mar 21 •
Futures ticker confusion
I have always been confused by the variation of tickers for the contract month. My Trading View shows MES1!, but the Ninja trader shows MES MAR25, and the price is not the same, the chart candles are not the same. How do I ensure I am synced and using the same ticker across the platforms when the names are not ever the same?
Mar 7 •
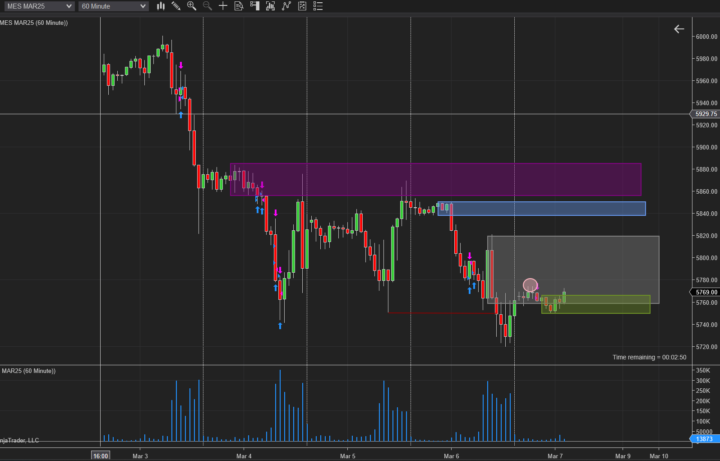
Help drawing order blocks
I am getting back into this after a fall-out. I am struggling to properly identify order blocks in some cases. The previously tapped bearish purple order block, I believe, is easy enough for me to identify. Similarly, with the untapped blue order block, underneath of it. These are straight forward for me. Where I struggle is when price appears to spike up before continuing to drop, or when prices consolidate. The bearish gray order block I have drawn, is this correct? In the videos, Kyle talks about picking the "origin of the move." To me, the origin is the blue area, not the spike in price and then drop of the gray area. Please advise. These overnight prices from NYC, without a lot of volatility, create confusion for me. Having the ability to trade the London session would be helpful for me, so I'd like to understand these areas better and how to properly draw out the blocks. Is the green block valid? It did create a consolidation there of 5 hours before price closed above, but there is another protected high right above it (circled) that makes me think I should wait for price to close above it? Any thoughts on the above would be appreciated.
1 like • Mar 13
@Stephen Gerald Onyia I particularly enjoyed your video! Thanks for sharing :)

👑
Mar 3 •
Bootcamp Day 1
Tomorrow at 7pm est we start Day 1 of the bootcamp! We'll be going through all kinds of golden nuggets: - The best income opportunities in a digital world (hint...day trading might be on the list lol) - The habits and routine needed to be successful with day trading - Day trading strategy to make income in any market environment If you haven't registered yet (or need the recordings) you can sign up here: https://kylehenris.com/bootcamp Come prepared to learn 🧑🎓
1 like • Mar 5
The login to the boot camp isn't working
Oct '23 •
Unlocking bonuses
I am ready to unlock to bonuses. I've invited a friend, so the first bonus should have unlocked but it hasn't. Do they have to act on the invite, or join in order for me to get the bonus? Regarding the second bonus...How should we submit a video?
1-6 of 6

Active 6h ago
Joined Sep 14, 2023
Powered by