Activity
Mon
Wed
Fri
Sun
Aug
Sep
Oct
Nov
Dec
Jan
Feb
Mar
Apr
May
Jun
Jul
What is this?
Less
More
Memberships
Investor Edge Club
64 members • Free
130 contributions to Investor Edge Club

🔥
2d •
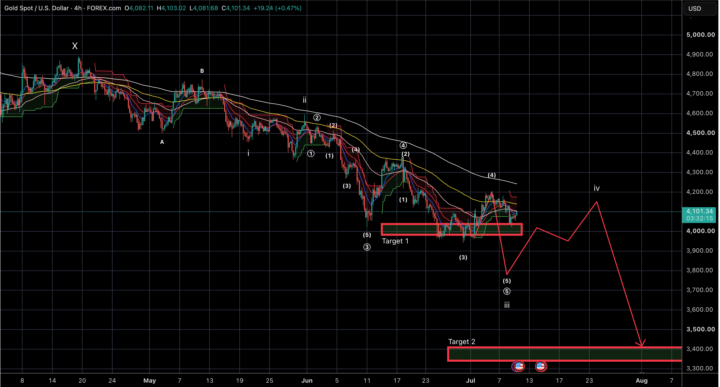
Gold - Clearer Path
Date: 09/07 From our last post we had highlighted a bullish as well as bearish scenario for Gold. At the moment prices have reversed and price action is leaning in more towards our bearish scenario. So according to this scenario - where do we stand? Gold price seems to be moving down to complete its 3rd wave of wave C. This 3rd wave is to come down as an impulse - here we are currently in wave 5 with the current pullback being marked as the 4th save of this impulse. Once this 3rd wave completes we can expect another pullback - one that is possibly longer drawn in both terms of price as well as time before a final 5th wave on the larger scale coming down towards 3600 - 3400 levels depending on where our 4th wave ends. Golds strongest and biggest rally is meant to follow this correction. They won't make it easy to catch the reversal. We need to be sharp and ready with all different scenarios 🚀💪 Attaching 4H and 1H charts for clarity below
3 likes • 2d
Was expecting this too! Even considering the macro conditions. I don't think we are ready for gold to have bottomed just yet
🔥
2d •
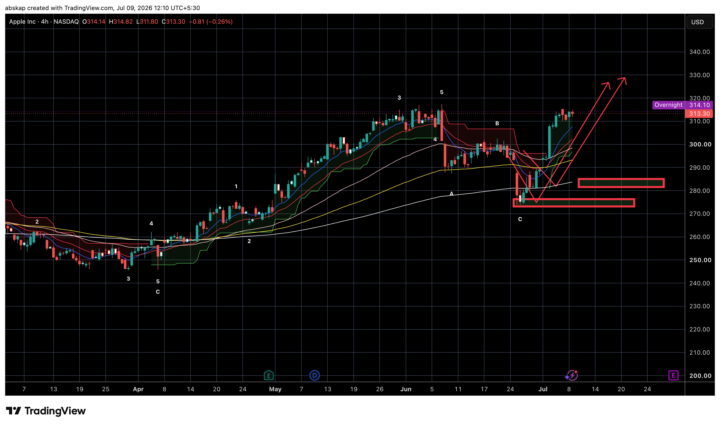
Stock Update: Apple
Date: 09/07 Just sharing this update on Apple. We shared a buy call on it on 23/06 and since then prices have come exactly into our buy zone and reversed. Prices are already 15% up from our buy call and following the exact structure given. Sharing charts below!
2 likes • 2d
YES! I added it to my portfolio at the given levels 🚀
🔥
9d •
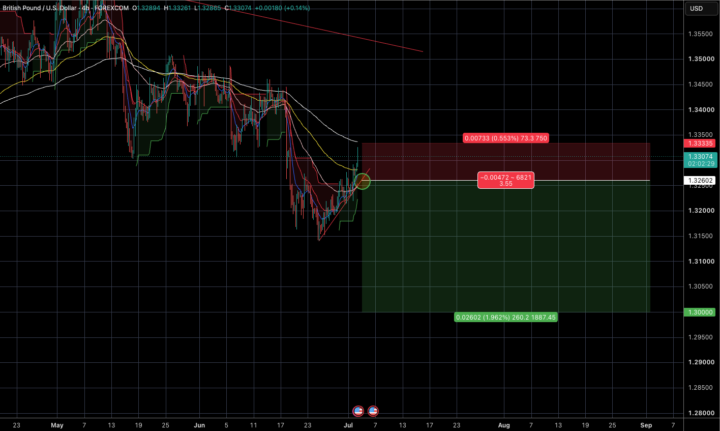
GBPUSD Trade
Sell below - 1.2600 (sustained break of trend line) SL - 1.33261 (Swing High created once trade active) Tgt - 1.3000 RR - +3.5
2 likes • 9d
This upmove looks corrective in nature 😎
1 like • 2d
Waiting for this to activate!
🔥
7d •
🌊 Elliott Wave Traders... I've Got a Question.
Which corrective pattern do you find the hardest to identify in real time? A) Zigzag (5-3-5) B) Flat (3-3-5) C) Triangle (3-3-3-3-3) D) W-X-Y Combination E) W-X-Y-X-Z Triple Combination 💬 Which one gives you the most trouble, and why? I'd love to hear everyone's experiences. Once a few people have replied, I'll share some of the things I look for when trying to distinguish between the different corrective structures.

1 like • 7d
Going to stick with the group here and say wxy and wxyxz are the worst. You just can't be sure when they're done. I like flat corrections - I find they are easy to identify
1 like • 2d
@Abhishek Kapadia For sure
🔥
7d •
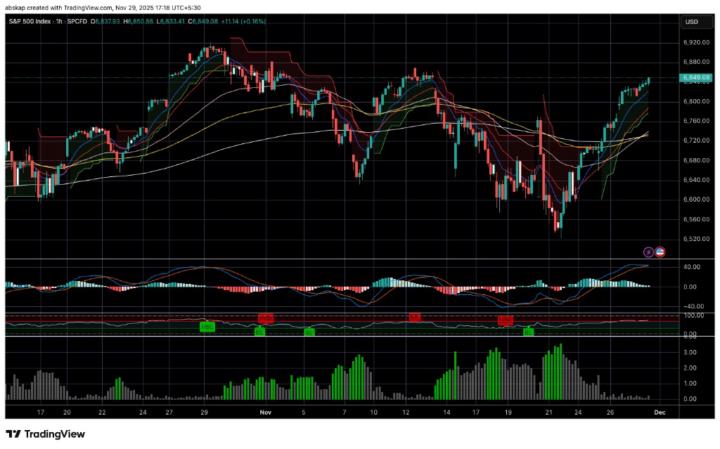
Weekly Market Outlook (6th July)
Recap of last week: - US Oil still drifting towards our next target of 65 as discussed. Current low sitting at 67 but still no confirmation that wave 4 has begun - US30/US100 saw some early pressure but the dips were bought more so in the US30 which gave a pretty strong weekly close. US100 still base building but ready to launch - Gold and Silver remained strong last week and have given a good rise from their swing lows Factors for this week: - Oil should soon find its bottom (of wave 3) and begin wave 4. We were expecting this last week but no signs yet to confirm that wave 4 has begun. - US30 - Going strong and will continue to rise. May have a bumpy day mid week but continue to buy on dips until 54000+ levels are here - US100 - Base building should be done. US100 seems set to rally this week as well - US dollar is almost ready to complete its corrective pullback and begin the next step of its rally - Gold and Silver are at an important juncture. This week will be very important in determining which scenario they fall into. A strong week breaking important levels could prove that the W4 corrective is over. However, if bearishness comes back in midweek and gold / silver close the week with a bearish candle, chances are we are going to see new lows in both the commodities.
1 like • 7d
Should we look to book out of the US Oil shorts? at around 65 levels? I imagine W4 is going to be long and annoying since W3 really bought the price down
0 likes • 2d
@Ryan Williamson YES!!!
1-10 of 130