Activity
Mon
Wed
Fri
Sun
Aug
Sep
Oct
Nov
Dec
Jan
Feb
Mar
Apr
May
Jun
Jul
What is this?
Less
More
Owned by Henry
Most people lose money trading because they overcomplicate it.I teach busy professionals to trade options in 30min/day using one system.40,000+members
Memberships
23 contributions to Options Trading for Beginners

3h •
Live moved to zoom 5:15pm
Topic: OTB Meeting Place Time: Jun 21, 2026 06:00 PM Arizona Join Zoom Meeting https://us02web.zoom.us/j/88147737015?pwd=O6MQXLSFWiRVSX4sCZPoFj7txXgb2U.1 Meeting ID: 881 4773 7015 Passcode: 539526
1
0
3h •
Live moved to zoom - 5:15pm
Topic: OTB Meeting Place Time: Jun 21, 2026 06:00 PM Arizona Join Zoom Meeting https://us02web.zoom.us/j/88147737015?pwd=O6MQXLSFWiRVSX4sCZPoFj7txXgb2U.1 Meeting ID: 881 4773 7015 Passcode: 539526
1
0
3d •
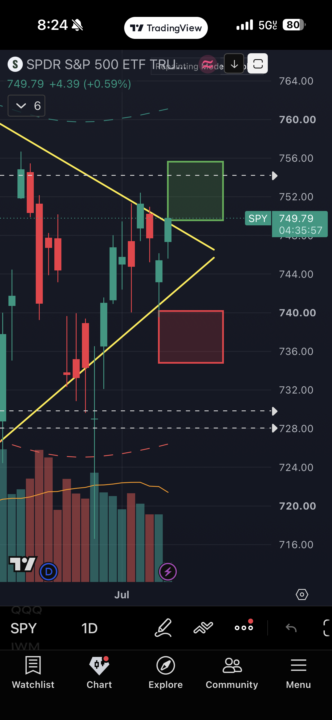
📊 SPY — WHAT I’M SEEING TODAY also free class on Sunday
🟢 Chart is sitting right at a decision point. We’ve been carving out what looks like a pennant/wedge on the daily — higher lows grinding up against a descending trendline, currently coiled around $749-750. Green box overhead ($752-756) is the breakout zone. Red box below ($736-740) is where it likely retests if it fails. This is a “prove it” chart. It hasn’t broken structure yet either direction. 📞 Options flow note: P/C ratio is showing real call buying underneath the surface — bigger than what the chart itself has confirmed yet. That’s the tell I’m watching. Flow is leaning bullish before price has committed. Doesn’t mean it’s right, means someone’s positioning for it. 🗞️ Macro backdrop (why I’m not just trusting the flow blindly): The soft jobs report bought the market a little hope — “maybe cuts are still in play.” I’m not convinced that’s the full picture. Between a midterm election year, the yen carry trade no longer being free money, PDT rule friction on smaller accounts, and headline liquidity pressure from moves like SpaceX’s raise — there’s a lot working against a clean breakout right now. What used to be an easy tailwind isn’t as easy anymore. 🎯 Bottom line: I don’t predict — I react to the reaction. Flow says calls are loading. Chart says “not yet.” Macro says “be careful chasing this.” Until SPY actually clears $752-756 with volume behind it, I’m treating this as a range, not a trend. That’s also why I’m carrying a few small put protections right now — not a bearish call on the market, just insurance while the chart makes up its mind. Not financial advice — this is my personal read for teaching purposes only. Always manage your own risk.
1
0
7d •
Sunday Check In
🎆 FINANCIAL INDEPENDENCE DAY This weekend we celebrated freedom. Today's video is about a different kind of independence — the kind where the market works for you, not the other way around. 📼 New Sunday video is live — full week-ahead breakdown: 🔹 Markets reopen Monday after the holiday weekend, first session since Thursday's close 🔹 Key data drops this week: Services PMI Monday, FOMC minutes Wednesday, jobless claims Thursday 🔹 SPX has been choppy — tech/AI names under pressure while industrials, financials, and small caps have been picking up the slack 🔹 We're watching whether the broader market can hold its trend while the "Mag 7" trade cools off This is exactly the kind of week where having a system matters more than having an opinion. React to what the chart shows you — not to headlines. 🎥 Watch the full breakdown Want the Order Flow Guide + our "5 Mistakes Beginner Options Traders Make" breakdown? 👉 Comment "FLOW" below and I'll send both over. Freedom isn't just a day on the calendar. It's a skill you build one setup at a time. ⚠️ Not financial advice. Educational content only. Options trading involves substantial risk. — Henry | OTB 🎯 https://youtu.be/9m3Gc5a-wpo
4
0
1-10 of 23

@henry-husges-6519
Options Trading for Beginners
We teach busy people how to trade options with clarity and discipline—no hype, no signals, just a proven system.
Active 2h ago
Joined Jun 27, 2026