Activity
Mon
Wed
Fri
Sun
Apr
May
Jun
Jul
Aug
Sep
Oct
Nov
Dec
Jan
Feb
Mar
What is this?
Less
More
Owned by Derrick
Learn how to read the charts
Memberships
2 contributions to Day Trader

Nov '25 •
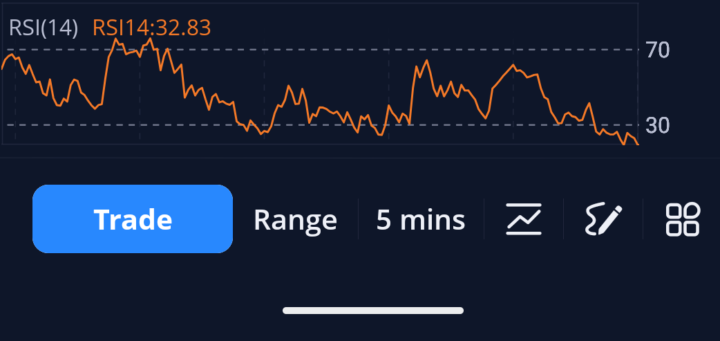
RSI also know as Relative Strength index
In the first photo attached below, that is your RSI chart, also known as relative strength index. The second photo shows the whole chart in that RSI follows the chart. The RSI will let you know if the stock that you are choosing to trade is oversold or overbought. In order to figure this out you must understand how the market moves, and that the market moves in three ways meaning up down and sideways.. you will barely see the market only move sideways for the whole day, so therefore you will know that the market moves up and down after hitting the 70 mark on RSI or hitting the 30 mark on RSI, this is the most simplest chart read Rsi and place your bet correctly.. if the RSI is all the way at the bottom, as you see in the first photo attached. it is around the 30 Mark and a little bit under the 30 Mark. That means it is oversold and you're looking for an uptrade/ reversal in the market. We will talk about how to spot a reversal as well, but right now we will stick to RSI. If RSI is at the 70 Mark or above it is overbought and you're looking for a downtrade. And let me explain the up and down of your trade. The way I trade the market is that I buy contracts for a certain amount and that contract that I buy is either a contract to buy the market going up or to sell the market going down. To clarify, if the market is heading up you make a trade that says that it is going up. If it's heading down you make a trade that says it's going down and in order to do that you have to trade Options trading. The best place to enter your trades is either at the peak of the 70 Mark or at the peak of the 30 Mark. The market usually reverses after being above the 70 Mark or way below the 30 Mark and if you get into an entry on either side at the peak that will be good money for you to let it travel all the way from 30 to 70 or 70 to 30... Refer to the first picture to understand this whole spiel Next lesson will be on MacD
1
0
Nov '25 •
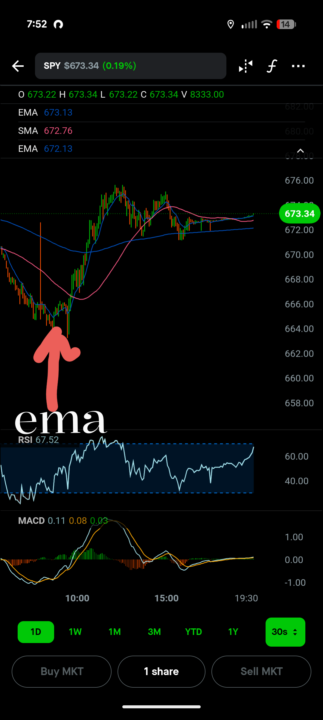
Chart reading 101 made easy
I'm going to get straight to the point. There are three lines that I pay attention to when trying to figure out where to place my trades when dealing with the market.. The three lines are called the exponential moving average or you can call it just the moving average, but I like to use the exponential moving average itself.. The platform that I use are Robinhood and webull ... Once you sign up on either app you'll be able to customize the chart to your liking. Okay, back to the EMAs also known as exponential moving average. Out of the three Ema lines there's one line that usually crosses two of those EMAs depending on the direction that the EMA is crossing. For example, the EMA is crossing the two lines going up, your trade should be for the upside. if it's crossing the two EMAs lines heading down Your trade should be for the downside If the EMA is crossing down. In the picture attached to this lesson here, will show you the three lines, along with the Christmas color candlesticks that are red and green, that too also has a line inside of it and that is the main exponential moving average that you will be looking at crossing the other two lines. All three lines are your exponential moving averages you can go into the settings to change the colors as well for it to be more visible to you and your liking, but other than that, this is the first part of reading the chart and knowing where to place your trade To get a little more in-depth on these exponential moving averages the line with the Christmas colors is the line that you will be paying attention to, as far as watching if it will cross the other two exponential moving averages For example The market always opens at 9:30 Eastern standard Time, And as you can see, where I placed the arrow is almost where the market opens. I just want to place the arrow there so you know that is also a exponential moving average. Starting from where the arrow is the exponential moving average started at the bottom and started heading upwards and crossed the first line. So therefore your trade should be on the upside. It continued to cross the second line. Therefore, you should hold your trade to collect more money from the market as it heads up. now the trick to learn is to know how long you'll be staying in the trade. And that will be our next lesson.
2
0
1-2 of 2

@derrick-louizia-2869
Hi my name is Derrick I love trading stocks and making a change or difference in my life and other lives as well ... Knowledge is power
Active 8d ago
Joined Nov 15, 2025
Utah
Powered by