Activity
Mon
Wed
Fri
Sun
Aug
Sep
Oct
Nov
Dec
Jan
Feb
Mar
Apr
May
Jun
What is this?
Less
More
Memberships
The Watering Hole Community
5 members • Free
BIZ Academy
54 members • Free
1 contribution to The Watering Hole Community

15d •
IWM DAILY GAME PLAN
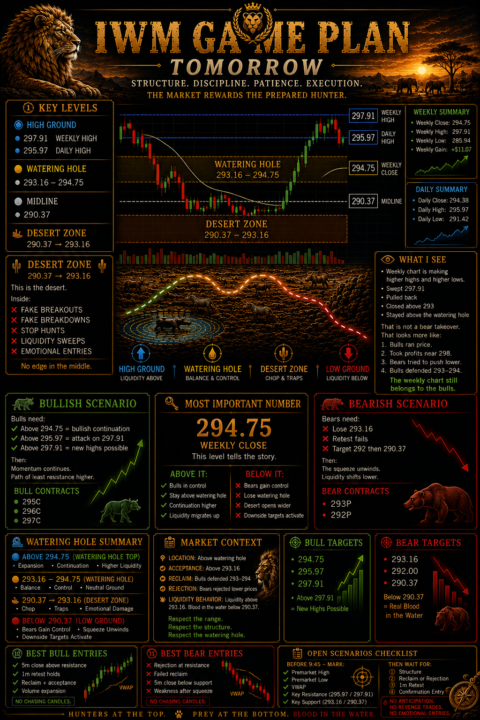
Weekly Chart * Weekly close: 294.75* Weekly high: 297.91* Weekly low: 285.94* Weekly gain: +$11.07 Daily Chart * Daily close: 294.38* Daily high: 295.97* Daily low: 291.42 Watering Hole Levels 🔵 High Ground * 297.91 (weekly high)* 295.97 (daily high) 🟡 Watering Hole * 293.16–294.75 ⚪ Midline * 290.37 🏜️ Desert Zone * 290.37 → 293.16 ⸻ What I See The weekly chart is still making higher highs and higher lows. Price: * Swept 297.91* Pulled back* Closed above 293* Stayed above the watering hole That is not a bear takeover. That looks more like: 1. Bulls ran price.2. Took profits near 298.3. Bears tried to push lower.4. Bulls defended 293–294. Friday Game Plan 🐂 Bull Case * Above 294.75 = bullish continuation.* Above 295.97 = attack on 297.91.* Above 297.91 = new highs possible. Contracts: * 295C* 296C* 297C 🐻 Bear Case * Lose 293.16.* Retest fails.* Target 292 then 290.37. Contracts: * 293P* 292P Blood in the Water The real blood in the water is below 290.37. If bulls lose that level, there is a lot of trapped buyers from this week’s move. Until then, the weekly chart still belongs to the bulls. Friday Hunter’s Map Calls Above: 294.75 → 295.97 → 297.91 Puts Below: 293.16 → 292.00 → 290.37 Desert Zone: 290.37–293.16 Watering Hole: 293.16–294.75 High Ground: 295.97–297.91 The first 15-minute candle tomorrow will tell you whether they want to defend the watering hole or drag price into the desert. That’s the level I’d watch before choosing calls or puts.

1 like • 15d
💯
1-1 of 1
