Activity
Mon
Wed
Fri
Sun
Sep
Oct
Nov
Dec
Jan
Feb
Mar
Apr
May
Jun
Jul
Aug
What is this?
Less
More
InvestCEO Boardroom
606 members • Free
InvestCEO with Kyle Henris
45.1k members • Free
177 contributions to InvestCEO with Kyle Henris

18d •
First pay out!
I have been learning about day trading for about 10 months.. Spent the first few months poking around on YouTube and scrolling various Reddit threads to no avail.. Then in February I was lucky enough to join InvestCEO thanks to a fellow member who reached out, and today I have just earned my first pay out! Very grateful for this community and in particular the coaches. Thank you 🙌

1 like • 14d
Nice work! Congrats to you! It's quite an accomplishment!

18d •
Monday Money Tips (8/3/26)
Last week we talked about 401(k) plans. In this week's Monday Money Tips we take a deep dive on 457(b) plans.
1 like • 18d
Thanks Coach!

Jul 8 •
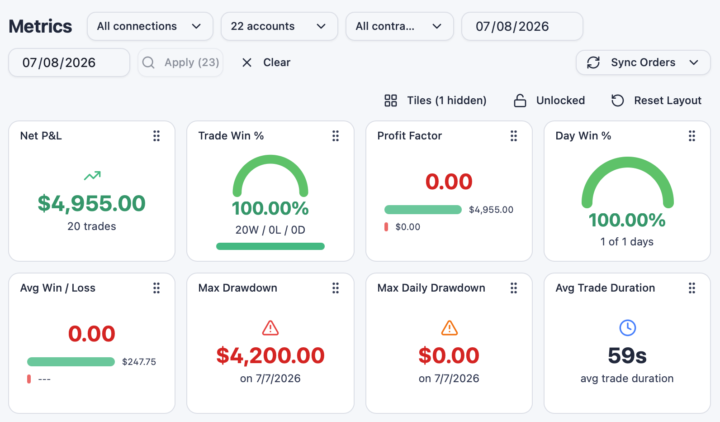
The power and protection of scaling with low risk
Why invest in a few accounts to add to the algo each month? Because tiny risk can achieve this in one trade when it's multiplied by many accounts.
1 like • Jul 8
A great snapshot of scaling made possible by the ease of using Echo! Really captures the power of its utility.

May 29 •
Last Son Indicator
Can someone show me an example of the correct placement of entry blocks when using the Last Son indicator??
5 likes • May 30
The last son is based off Points of interest. example your overnight highs and lows. those would be specifically the Asian session highs and lows and the London session highs and lows. then we also like to mark out with a ray the daily highs and lows from the previous day or further days back depending on price direction as probable target for price to migrate to. this is done on the daily chart and the hourly if you're just beginning. make sure you have the indicator called Fractals by Rachael T turned on. fractals are significant points where price has reached a high or low across multiple timeframes. anyways, when we watch the charts on the 1 minute timeframe we are waiting for price or candles if you will to give us evidence that price is going to continue in its current direction or reverse at the points of interest we have marked on the daily and hourly charts. the trade can happen once we see the confluences needed like a market structure shift, with a fair value gap above or below the point of interest. there's some nuance to this but without typing a book this is it..the "Last Son"

👑
May 27 •
🤖ALGO TEMPLATES: Week in Review 5-18 - 5-22
A look at algo template reviews from last week along with important template updates!
1 like • May 27
Thanks Kyle
1-10 of 177
@craig-pohutski-3534
industrial electrician
Ford, Livonia Automatic transmission plant
Active 1h ago
Joined Sep 27, 2024
Rockwood, Michigan
Powered by