Activity
Mon
Wed
Fri
Sun
Aug
Sep
Oct
Nov
Dec
Jan
Feb
Mar
Apr
May
Jun
Jul
What is this?
Less
More
Owned by Brad
Understand why you think, feel, and react the way you do and develop greater self-awareness through the Enneagram.
Memberships
9D Breathwork Community
33.1k members • Free
AI Automation Society
423.1k members • Free
Path of Purpose
297 members • Free
The Weekly Flips for Parents
71 members • $9/month
Daily Rituals Skool
12 members • $5/month
The Aligned Collective
34 members • Free
Business Leadership Trenches
13 members • Free
Youtube Mastermind Free
1.7k members • Free
Stop Starting Over
10 members • Free
39 contributions to Investor Edge Club

🔥
18d •
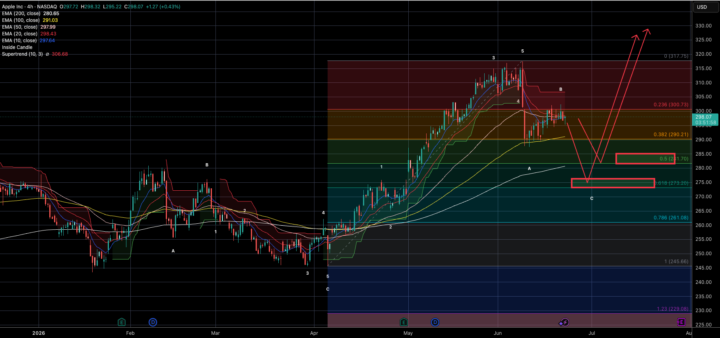
Stock Opportunity: Apple
Date: 23/06 Apple made a strong base in April around the 245-248 mark with a swing low of 245 being formed on the 7th of April. Since then, Apple has galloped up around 30% forming a swing high of 317 on the 8th of June. The current structure that Apple’s price action is following post the swing high is that of a correction. The swing high has been achieved in a perfect impulse leading us to believe that the low of 245 till the high of 317 forms the first impulse of this cycle. We are now on the lookout for the completion of Wave 2. This pullback should come down in the form of a zig zag corrective and complete 50-61.8% retracement of W1. The chart suggests that we are currently in wave B of 2 with wave A having completed with a low forming at around 288 lvls. Once wave b (upward pullback) is complete I am expecting a final corrective leg of wave C to play out and bring prices to between 280-270 levels. This area will be a perfect area to enter into to catch our 3rd wave up with a strict stop loss of 245 (start of impulse). Wave 3 is usually the strongest and most powerful wave of an impulse and the apple chart suggests targets of 360+ This is a great area to add Apple to the portfolio as an investment as well as a great trading opportunity. Thanks to our member @Suresh Appayi for bringing this opportunity to my notice! Sharing chart below

2 likes • 16d
@Jason King do it! It has treated me well.
1 like • 15d
@Abhishek Kapadia right def seen those methods. For one, I take the dividend and invest it elsewhere. Then I also look at it as a total of net worth. So lets say it is 6% of net worth. I have a few businesses that are worth more, real estate and then stocks. So if you look at everything it is small. Now if you just look at my stock portfolio individually then yes I am 20-25% apple. I sometimes say if this particular stock goes to 0 am I ok. It's been my philosophy. The one business is growing fast and will just blow the rest of everything out of proportion. We can't sell the stock until a certain point but it is most liquid of the two businesses. I'm trying to make the other business liquid as well eventually.
🔥
18d •
📊 What's Your Biggest Investing or Trading Weakness?
If you're being completely honest, what do you think holds you back the most? A) Impatience B) Taking profits too early C) Holding losers too long D) Overtrading E) Lack of confidence F) Not sticking to a plan G) Something else For me, one of the biggest lessons over the years was realising that most mistakes weren't analysis mistakes... They were decision-making mistakes. The chart wasn't the problem. I was. 💬 What would you say is the biggest thing you're currently working on improving? Let's see if we have some common themes across the community 👇
1 like • 18d
C and G. C probably due to G. Not having enough time to study and watch the market.
🔥
20d •
50 Members!
Hey everyone! Just wanted to write a quick appreciation post to all our members here in the community. We are now 50 members strong! 💪 I know a lot of members are fairly quiet - looking and reading on in the community. I want to thank each and every one of you for being a part of the Investor Edge Club. I am also extremely thankful and appreciate all our members that actively message me or contribute posts, questions, likes or comments to the community! This page/community would not function without all of you. Thanks everyone and let's keep learning, sharing and conquering the markets together! 👌🙏🚀
1 like • 19d
Awesome! Congrats!
🔥
25d •
🧠 What would you do?
🟡 Gold at All-Time Highs... 📈 Indices near highs... ₿ Crypto attracting attention again... So here's a question: If I gave you $100,000 today and told you that you couldn't touch it for the next 5 years... Where would you put it? 🟡 Gold 📈 US100 / Tech 🏛️ US30 📊 ETFs ₿ Crypto 🏦 Cash 🏠 Property 🤔 Something else And more importantly... 👉 Why? No right or wrong answers here — I'm genuinely curious how everyone is thinking about the next 5 years rather than the next 5 days. Let's see where the community's conviction lies 👇
2 likes • 25d
Balance it out. Have some cash for pullbacks. Property is over valued in most areas. Also search for more undervalued stocks like how gold ans crypto are.
🔥
Jun 10 •
🌊 Quick Elliott Wave Challenge
No charts. No indicators. No Googling. 😄 If you had to choose just one market right now that you think will offer the best opportunity over the next 3–6 months, what would it be? 🟡 Gold ⚪ Silver 📈 US100 (Nasdaq) 🏛️ US30 (Dow) 💵 Forex ₿ Crypto 📊 Individual Stocks And the important part... 👉 Tell us why in one sentence.
2 likes • Jun 10
I was starting to research some individual stocks and see what is undervalued in this market. Looking for some good long term purchases with upside potential in their markets. Merging that with the elliot waves would help me find a good entrance point.
1-10 of 39

@brad-weyant-6190
Integral Coach & Enneagram Teacher | Move beyond personality. Live from essence.
Online now
Joined Dec 11, 2025
Austin, TX
Powered by