Activity
Mon
Wed
Fri
Sun
Sep
Oct
Nov
Dec
Jan
Feb
Mar
Apr
May
Jun
Jul
What is this?
Less
More
Owned by عبدالعزير حسن
Memberships
0ne Ai
2.9k members • $149/month
Faceless Builder Academy
597 members • Free
AI Automation Society
431.3k members • Free
12 contributions to Learn trading

Jan 29 •
تحليل الاسواق
يعتقد الكثير من الناس أن التداول مجرد تحليل رسوم بيانية واختيار وقت مناسب للدخول والخروج، لكن الواقع أكثر تعقيدًا من ذلك. تشير الإحصاءات إلى أن نسبة كبيرة من المتداولين الأفراد تخسر أموالها خلال الأشهر الأولى، ليس بسبب السوق نفسه، بل بسبب طريقة التفكير والسلوك أثناء التداول. في هذا المقال، نناقش الأسباب الخفية التي تجعل المتداولين يخسرون، وكيف يمكن بناء عقلية تداول التداول ليس مشكلة تقنية بل نفسية معظم المتداولين يعرفون أساسيات التحليل الفني، لكنهم يفشلون في الالتزام بها. السبب يعود إلى: الخوف من ضياع الفرصة الرغبة في تعويض الخسارة بسرعة الطمع عند الربح هذه المشاعر تدفع المتداول إلى اتخاذ قرارات غير عقلانية، مثل الدخول في صفقات متأخرة أو مضاعفة المخاطرة بدون خطة.مختلفة تساعد على البقاء في وهم السيطرة على السوق يظن بعض المتداولين أنهم قادرون على “التغلب” على السوق إذا استخدموا مؤشرات كثيرة أو استراتيجيات معقدة، بينما الحقيقة أن: السوق يتأثر بعوامل سياسية واقتصادية غير متوقعة أي استراتيجية لها نسبة نجاح محدودة الخسارة جزء لا يمكن تجنبه النجاح لا يعني عدم الخسارة، بل يعني التحكم في التداول المفرط: العدو الصامت من أكثر الأخطاء شيوعًا هو التداول بكثرة بدون داعٍ حقيقي، وذلك بسبب: الملل مراقبة الشاشة طوال اليوم الرغبة في استغلال كل حركة سعرية هذا السلوك يؤدي إلى: ارتفاع نسبة الخطأ استنزاف رأس المال الإرهاق الذهني المتداول الناجح ينتظر الفرصة المناسبة بدل مطاردة السوق.حجمها.السوق لفترة أطول
1
0
Jan 26 •
Understand the Forex Market
Before starting, you must understand how the forex market works: Forex is the global currency exchange market. Currencies are traded in pairs (e.g., EUR/USD, GBP/USD). Prices change based on economic news, political events, and market sentiment. Tip: Start by practicing with a demo account before using real money. 2. Use a Simple Strategy For beginners, simplicity is key. One of the most recommended strategies is the Moving Average Crossover: Step 1: Apply two moving averages to your chart (e.g., 50-day and 200-day). Step 2: When the short-term average crosses above the long-term average, it signals a buy. Step 3: When the short-term average crosses below the long-term average, it signals a sell. This strategy is easy to understand and works well in trending markets. 3. Risk Management Managing risk is crucial: Never risk more than 1–2% of your trading account on a single trade. Use stop-loss orders to limit potential losses. Avoid trading with emotions; stick to your plan. Example: If your account is $500, risk only $5–$10 per trade. 4. Start Small Begin with small amounts to learn without risking too much: Micro accounts or demo accounts are perfect for beginners. Focus on learning the market rather than making big profits immediately. 5. Learn from Experience Keep a trading journal to track your trades. Note what worked and what didn’t. Review your performance weekly and adjust your strategy accordingly. 6. Tools and Resources Trading platforms: MetaTrader 4 (MT4) or MetaTrader 5 (MT5) Economic calendar: track major news events Trading communities: forums, YouTube tutorials, Telegram groups Conclusion The best forex trading strategy for beginners is one that is simple, manageable, and focused on learning. Start with small trades, use risk management, and stick to a tested strategy like moving average crossovers. Over time, with patience and practice, you can grow your skills and profits in the forex market. 💡 Tip for AdSense: If you add images of charts, diagrams, or examples, your content will be more engaging, attracting more clicks from high-paying foreign visitors, increasing your earnings.
0
0
Jan 18 •
Earn from trading
Making money from trading is possible, but it's neither easy nor guaranteed. Success depends more on knowledge, discipline, and risk management than luck. Here's a practical and concise explanation 👇 First: What is trading? Trading is the buying and selling of financial assets with the goal of profiting from price differences, such as: 📈 Stocks💱 Currencies (Forex)🪙 Cryptocurrencies🥇 Commodities (gold, oil) How can you make money from trading? 1️⃣ Choosing the right type of trading Day trading: Quick trades within the day (higher risk). Short-term trading (Swing): Days to weeks. Long-term trading: Investment based on fundamental analysis. For beginners 👉 Short-term or long-term trading is preferred.
0
0
Jan 12 •
حركة التصاعد
الحركة الصاعدة مدفوعة بشكل أساسي بالوزن المالي ، وبعض العقارات / النقل يتعاونان أيضًا ، وهو إصلاح هيكلي وليس زيادة عامة في السوق. الطاقة وبعض الصناعات ضعيفة نسبيًا ، مما يعكس أن السوق لا يزال يستوعب تقلبات أسعار النفط والدولار الأمريكي وتوقعات أسعار الفائدة وعدم اليقين الجيوسياسي. The upward move is mainly being driven by the financial sector, with some help from real estate and transportation, so it's more of a structural recovery than a broad market rally. Energy and some industrial sectors are lagging a bit, reflecting that the market is still processing oil price fluctuations, expectations around the dollar and interest rates, and geopolitical uncertainties
1
0
Jan 9 •
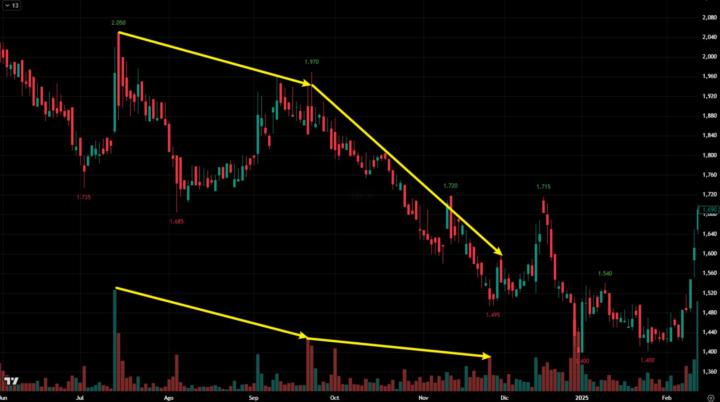
توضيح الرسم
يوضح الرسم الآخر حالة تباعد انخفاض السعر مع تقلص الحجم: حيث استمر سهم معين في الهبوط لعدة أشهر، وانخفض السعر إلى نصف قيمته تقريبًا في مرحلة ما. وما يجدر الانتباه إليه هو أنه مع انخفاض السعر تدريجيًا، تقلص حجم التداول من البداية التي كانت فيها كميات التداول كبيرة، ليصبح التداول ضعيفًا جدًا عند الوصول إلى المستويات المنخفضة الأخيرة. Another chart illustrates a case of price down accompanied by volume down divergence. A stock fell steadily for several months, with its price at one point cut in half. Notably, as the price kept dropping, the volume shrank from huge levels at the beginning to very thin trading by the time the price reached its recent low.
1
0
1-10 of 12

Active 126d ago
Joined Jan 3, 2026
ISTP
Powered by